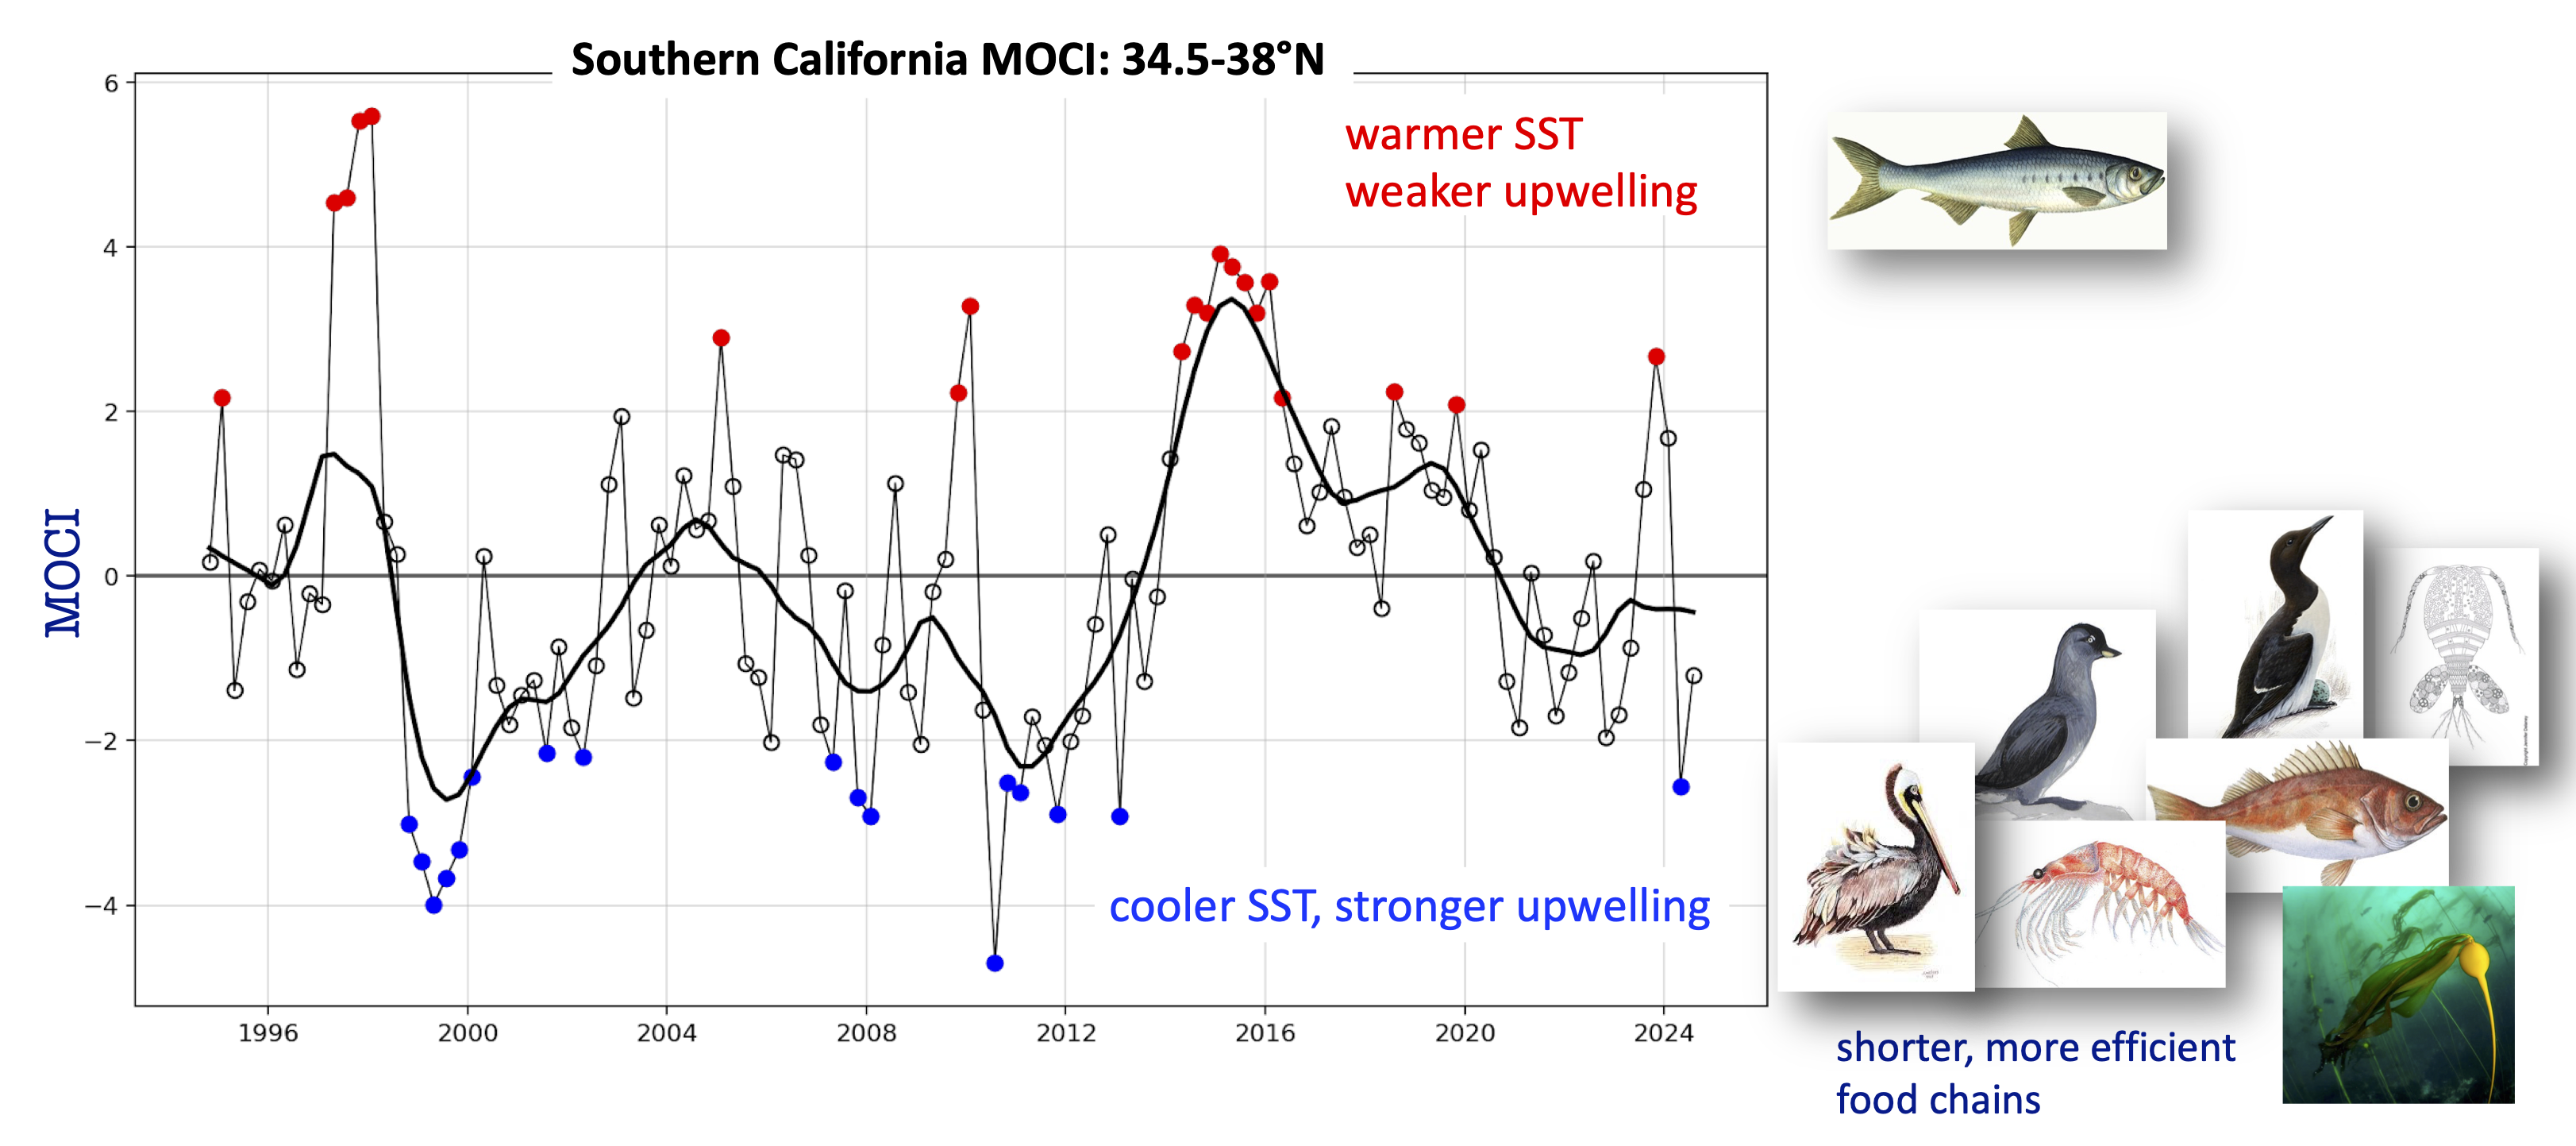
Above: Southern California MOCI, updated through September 2024. Large positive (red) values indicate warmer ocean conditions and weaker upwelling, which benefits Sardine recruitment. Negative (blue) values represent cooler ocean temperatures and strong upwelling, supporting a wide range of species, including kelp, copepods, krill, fish, and seabirds.
The West Coast ocean conditions are highly variable, influenced by climate events such as El Niño/La Niña and marine heatwaves. These changing conditions profoundly influence the marine ecosystem. Monitoring ocean variability helps us understand, manage, and predict ecosystem changes. Various indicators (e.g., Ocean Niño Indicator) and direct data (e.g., sea surface temperature) are used to track different aspects of the ocean across different locations and scales. However, selecting a single, suitable index to characterize change might be challenging due to the numerous options and the expertise required to understand, select, and use them effectively.
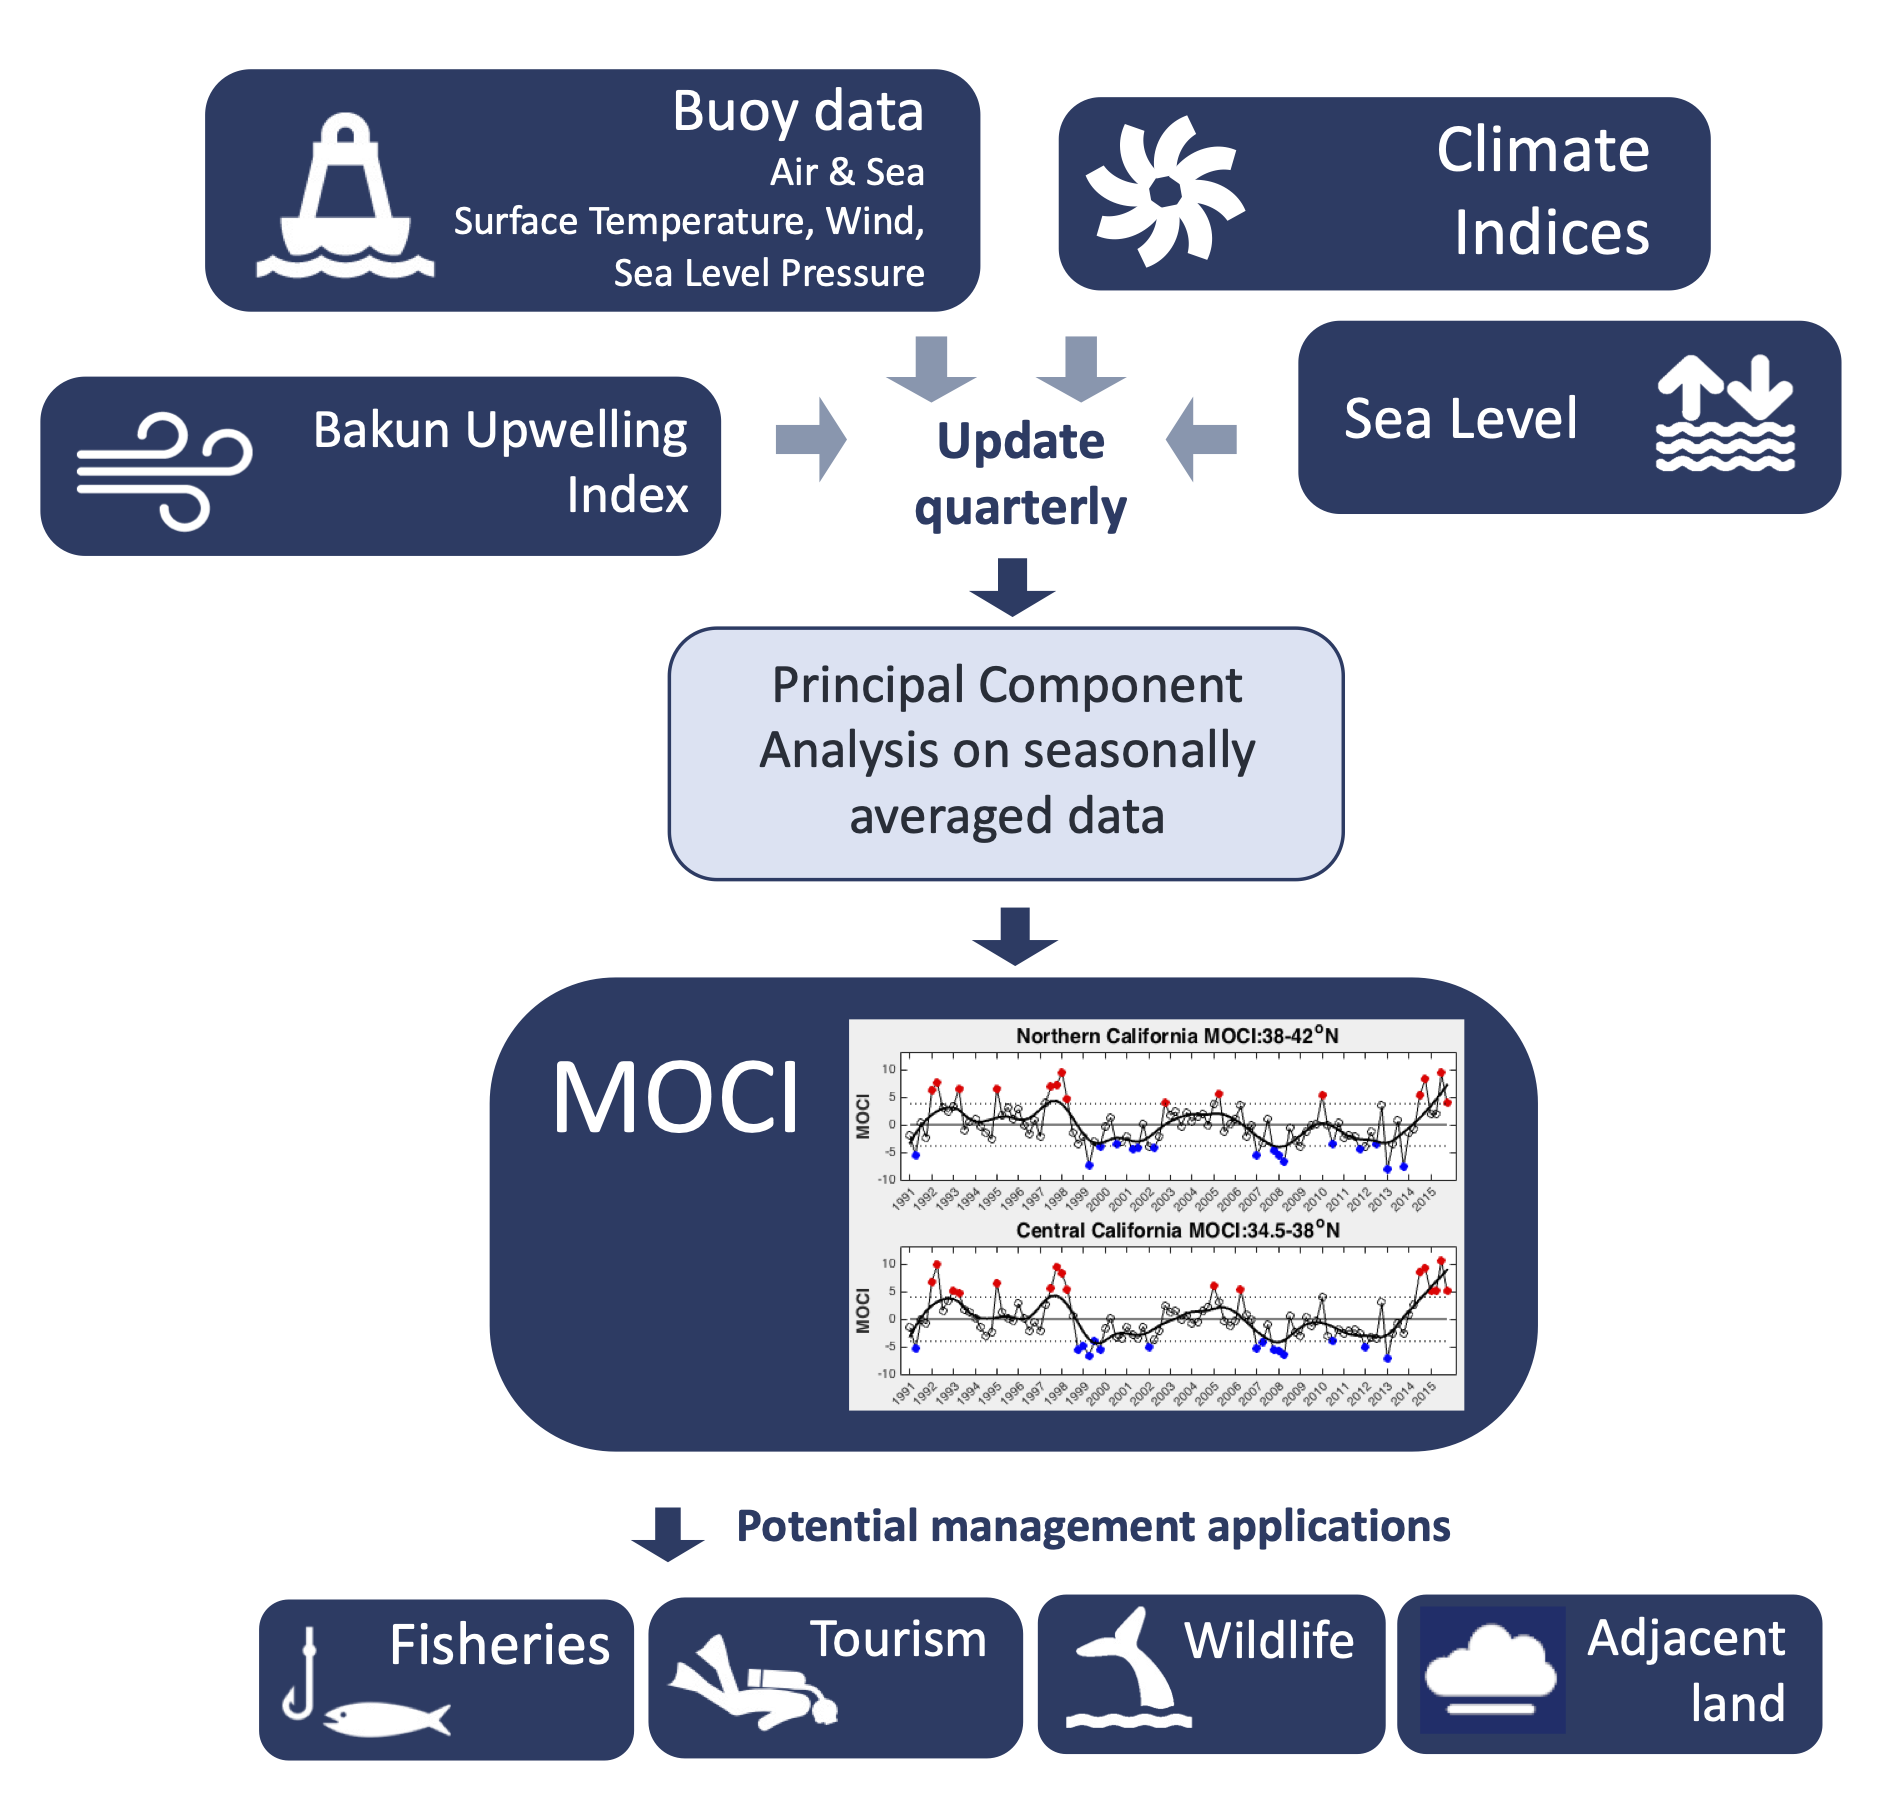
To address MOCI has been developed to synthesize multiple indices and variables that track changes across the three main domains of the California coast into a single, comprehensive indicator. Simplifying the acquisition and interpretation of marine conditions, MOCI incorporates publicly available data, and it is updated and shared seasonally in the CalOOS data portal and Farallon Institute’s website. Data included are temperature and wind data from buoys, sea level, the Bakun upwelling index, and climate indices (pictured below), capturing the primary mode of variability along the California coast.
Spanning 30 years, MOCI captures several El Niño Southern Oscillation events and the intensity and phasing of major North Pacific marine heat waves, including the Blob in (2014-2016) and the 2019 event (pictured above). MOCI also tracks variability in other environmental parameters, such as fog and river flow, and to coastal water conditions (e.g., salinity). MOCI is calculated separately for Northern, Central and Southern California, providing regional insights into the magnitude and timing of ocean variability across the state.
MOCI demonstrates skill as an ecosystem indicator across trophic levels, suggesting that it captures variability in biophysical processes relevant to ecosystem productivity, particularly upwelling-favorable winds and the modulating, though occasionally confounding, effect of water temperature. Seasonal MOCI correlates with concurrent biological indicators, making it a valuable tool when biological data has not yet been analyzed or made available. As such, MOCI holds potential significance for ecosystem-based fisheries and wildlife management in California.