Author: Clarissa Anderson, SCCOOS and Megan Hepner-Medina, SCCOOS.
Published: May 8th, 2020.
Updated: May 12th, 2020.
More data may be added to the bulletin as it becomes available.
Subscribe to the CA HAB Bulletin listserv
Summary:
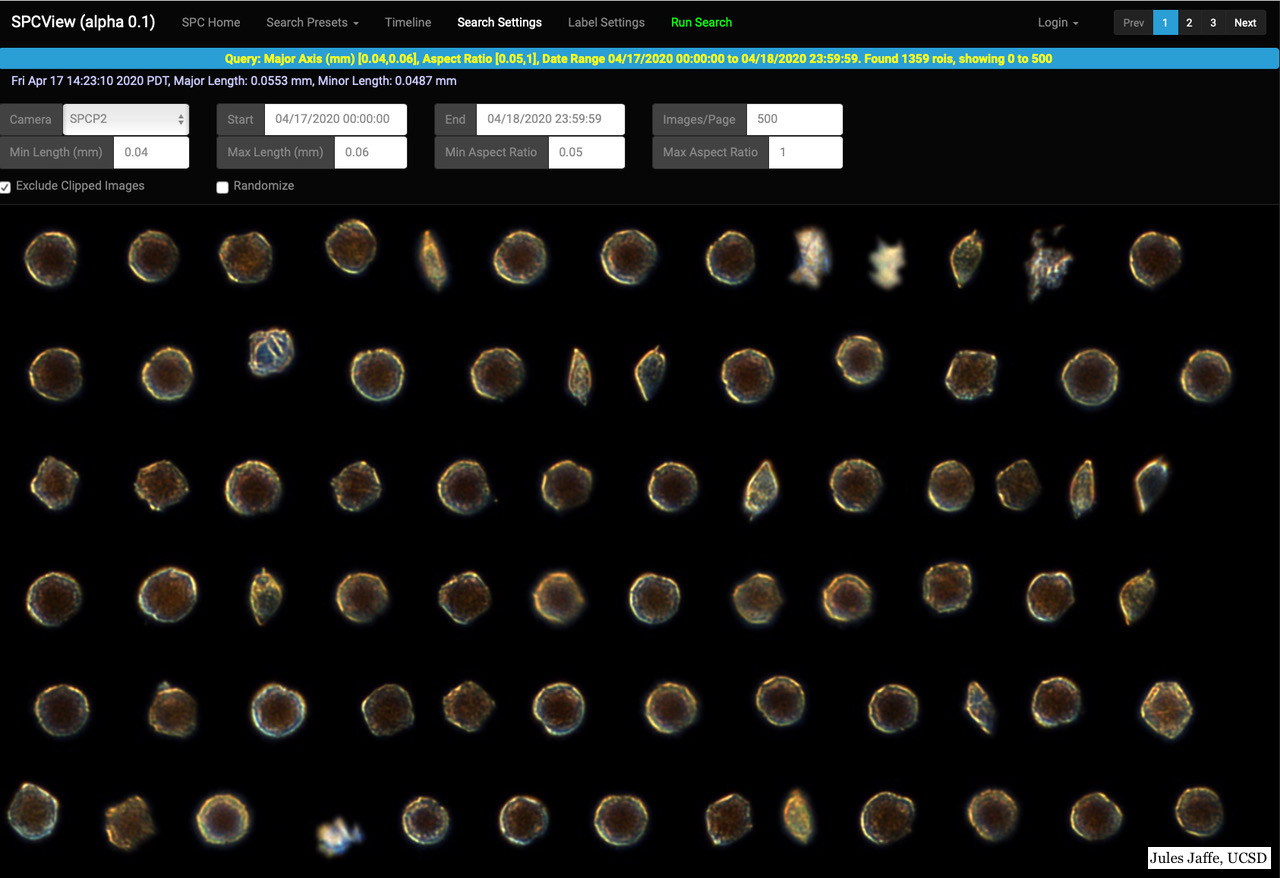
In late March, a robotic microscope deployed on a mooring that sits on the continental shelf offshore of Del Mar captured images of the early stages of a spring phytoplankton bloom. It was a fairly typical mixture of microalgae for this time of year when upwelling of deeper water is delivering nutrients to the well-lit surface layer. In the observations from March 31st (Fig. 6), the community was primarily comprised of chain-forming diatoms like Chaetoceros spp. and Pseudo-nitzschia spp. To a lesser extent, armored dinoflagellates were also observed including Gonyaulax spp. and Lingulodinium polyedra (Fig. 6). At the same time, the southern California coast was experiencing precipitation levels 200-400% above normal (Fig. 47-48). Lingulodinium polyedra really took off in early April as the rains subsided and the freshwater likely contributed to making the surface waters more hospitable to L. polyedra, an alga that is known for preferring “stratified” conditions when the surface layer is less saline/dense than the bottom layer. Like most phytoplankton, they also grow well when temperatures are warm, a factor which further contributes to the stratification. As the waters warmed in early April (Fig. 43-46) and wind was very low, conditions appeared perfect for the development of a widespread L. polyedra bloom that can be seen in satellite imagery extending from Los Angeles to Baja (with reports as far south as Islas de Cedros; Fig 43-44).
Indeed, the City of LA identified a community dominated by L. polyedra and peppered with other dinoflagellates like Ceratium spp. and Protoperidinium spp. (Fig. 9-12), while the robotic microscopes on the Del Mar mooring (Fig. 6-7) and Scripps Pier (Fig. 8) showed a bloom dominated by L. polyedra by early April. Early on, it may be that nutrients from runoff sustained active growth of the L. polyedra bloom but were likely not the cause of the bloom considering it was already developing further offshore away from the influence of terrestrial inputs. With so much biomass in the nearshore, however, it was therefore not a surprise that the beaches would become a spectacle of night-time bioluminescence (Fig. 1-5). These “red tides,” as they are often called, are not unusual in Southern California, and most California natives have seen bioluminescence at some point in their lives. What is especially unique this year is the incredibly high biomass that has led to very intense red/brown water (Fig. 15-20) and to some otherworldly light shows for weeks on end (Fig. 1-5). In fact, we now know that we were seeing the highest cell numbers of L. polyedra ever recorded at Scripps Pier with 9 million cells per Liter on April 27th (the previous maximum was just under 1 million cells/L). SIO scientists also measured the highest chlorophyll concentrations (1,083 micrograms per Liter!) since the Scripps Pier Chlorophyll Program began in 1983.
The long duration of the bloom is also out of the norm; most red tides in CA only last one or two weeks. While the water may appear red/brown, it is generally not a public health concern. Most phytoplankton can turn water red at high concentrations, so the red color is not an accurate indicator of potential harm. However, one concern with L. polyedra is that there are years of anecdotal reports from surfers and beach-goers claiming respiratory irritation from sea spray emerging near “red tide” water. This suggests that some fraction of the population may be sensitive to these aerosols. A second concern is that there is a toxin associated with L. polyedra known to occasionally cause harm in other regions and parts of the world and should be measured when a bloom becomes this prolonged. A third concern is that when there is so much organic material in the water, the end-stage of the bloom will lead to hypoxic (low oxygen) or anoxic (no oxygen) conditions and hydrogen sulfide production from bacteria. Low oxygen conditions do not support life and therefore kill fish and benthic organisms. In addition, light penetration into the water can be reduced by more than 95% by dense red tides, thereby affecting kelp growth, reproduction, and recruitment.
With the recent appearance of dead fish and invertebrates on beaches throughout Orange County and San Diego, particularly near semi-enclosed lagoons, it is clear that the bloom is causing harm (Vid. 2 & Fig. 24-29). It is important to ascertain if low oxygen (Fig. 37-40) and/or toxins are to blame. Recent appearance of foam on the beaches indicates rapid breakdown/decay of the bloom (Fig. 35-36). Interestingly, 1) the presence of dead fish in aquaria using natural seawater artificially adjusted for high dissolved oxygen (John Hyde, UCSD/SIO) and 2) observations of mussels releasing from their shells (Melissa Carter, UCSD/SIO and Jimmy Fumo, UCSD/SIO) suggests that toxins could be involved. Scientists in Ensenada, Baja are detecting yessotoxin in recent samples, indicating that the same may be occurring in southern California (Ernesto Garcia-Mendoza, CICESE). SCCOOS/SIO researchers will be analyzing these samples to try to better understand the causes and variability of the die-offs.
Phytoplankton
The early stages of the bloom were dominated by diatoms like Chaetoceros spp., Pseudo-nitzschia spp., and armored dinoflagellates, a large number of those being Gonyaulax spp. and Lingulodinium polyedra (Fig. 6-12 & Vid 1.). As the waters warmed in early April (Fig. 43-46) and wind was reduced, conditions appeared perfect for the development of a widespread L. polyedra bloom as seen in many water samples below.
Why is the ocean red-brown?
Just about all phytoplankton can turn the ocean effectively red when they are growing fast and producing a lot of chlorophyll. The dinoflagellate Lingulodinium polyedra is known to bloom at very high concentrations in nearshore waters of Southern California, often producing this deep red to brown shade when the reflected light hits our eyes. This has led to the term “red tide,” but widespread use of this term to describe a variety of blooms around the world is confusing. In some places like Florida, “red tide” is used to describe a deadly harmful algal bloom of the species Karenia brevis. Here in Southern California, L. polyedra blooms are usually benign.
Figure 15-20. Images of the red tide event in Southern California Bight. From left to Right. Figure 15. La Jolla Shores on April 23rd, 2020. Source: Lanna Cheng, UCSD/SIO. Figure 16. Scripps Institution of Oceanography flow-through tank on May 1st, 2020. Source: Adi Khen, UCSD/SIO. Figure 17-18. Agua Hedionda Lagoon, Carlsbad on April 27th, 2020. Source: Bailey Chapman, City of Carlsbad. Fig 19-20. La Jolla Shores on May 1st, 2020. Source: Michael Latz, UCSD/SIO. Figure NA. Water samples taken from King Harbor Marina, Manhatten Beach Pier, and Marina del Rey Marina on May 7th, 2020. Source: Mas Dojiri, LA Sanitation.
Chlorophyll-a Satellite Images
Figure 21-22. Chlorophyll-a 300-m image from Sentinel-3 Satellite and Ocean and Land Colour Instrument (OLCI) on April 15th and 22nd, 2020. Please note the images are processed for maximum coverage and not for compositing valid values. Source: Mati Kahru, UCSD/SIO. Figure 23. Chlorophyll-a image from Sentinel-3 Satellite and OLCI on May 1st, 2020. The algorithm is "coastal" and is only valid down to about 2 ug/L chlorophyll. The "saturation value" is >130 ug/L Chlorophyll-a. Source: NOAA/NCCOS processed from Copernicus data provided by EUMETSAT.
Figure 23b. Chlorophyll-a 300-m image from Sentinel-3 Satellite and OLCI overlayed with High-Frequency Radar at 1km, 2km, and 6km on April 14th, 2020. Source: Mark Otero, UCSD/SIO.
Why are dead fish and invertebrates washing up along our coast?
Oxygen in the water column can become depleted as the bloom decays and the organic matter is broken down by bacteria, oxygen becomes depleted in the water column. This is a function of high respiration rates of bacteria as well as nighttime cellular respiration by the algae. A hypoxic or anoxic environment is not conducive to life, so fish and invertebrates in the water column and particularly on the ocean floor are quite susceptible when a bloom of this size degrades. This effect is amplified in semi-enclosed bays and lagoons with little exchange with the ocean and reduced mixing with the atmosphere will experience even lower oxygen. Another factor is that newly upwelled water in California can also be low in oxygen and amplify the problem. Lingulodinium polyedra is also known to produce yessotoxin in some parts of the world, a toxin that could theoretically harm marine life.
Figure 24-29. Reports of dead fish (e.g., Bass, Sardines, and Rockfish) and invertebrates (e.g., Snails and Sea hares) washing up along our coast from Los Angeles to San Diego beginning April 30th, 2020. From left to Right. Figure 24. Dead Sardines at Kellogg Park, La Jolla on May 5th, 2020. Source: Dr. Meinrat O. Andreae, UCSD/SIO. Figure 25-27. Dead snail and Spotted Bass at San Dieguito River, San Diego on May 4th, 2020. Source: Susan Emrich. Figure 28. Dead fish along Batiquitos Lagoon, Carlsbad on April 30th, 2020. Source: Tim Murphy, City of Carlsbad. Figure 29. Dead fish floating in Agua Hedionda Lagoon, May 1st, 2020. Source: Halle Thompson, City of Carlsbad. Figure X-X. Washed up octopuses, lobster, fish and ray in Baja California on May 10th, 2020. Source: Lydia Ladah, CICESE. Figure X. Imperial Beach on May 10th, 2020. Source: Garrett Eaton, UCSD/SIO. Figure X-X. Sea dollar, mussels, and sea pansy, La Jolla Shores on May 11th, 2020. Source: Celeste Kroger, UCSD/SIO.
Figure 30-34. Samples from the stomach content of sardine and anchovies. Source: Ernesto Garcia Mendoza, CICESE.
Bloom Decay
Recent appearance of foam on the beaches indicates break down/decay of the bloom (Fig 35-36).
Understanding if the environment is low in dissolved oxygen will help us better tease out the varying factors influencing the deleterious effects to marine life. Moorings and piers with oxygen sensors give us a good picture of the high frequency changes in dissolved oxygen concentration from day-to-day. The Scripps Ocean Acidification Real-time (SOAR) Monitoring Program, led by the Dr. Jennifer Smith Lab in collaboration with Dr. Todd Martz and Dr. Andrew Dickson, has been measuring long-term, high-resolution variability in pH and temperature in coastal La Jolla using state-of-the-art instrumentation on the Ellen Browning Scripps Memorial (EBSM) Pier at Scripps Institution of Oceanography since March 2012. Measurement of dissolved oxygen (DO) was added in August 2018. SOAR is one of the only continuous, coastal Ocean Acidification monitoring sites on the west coast of the United States. For more information and access to data, please contact program manager Samantha Clements (smclemen@ucsd.edu) or Dr. Jennifer Smith (smithj@ucsd.edu) and visit their website.

Figure. Data from the SOAR miniDOT Oxygen Logger shows values in range expected to cause lethal effects in marine organisms due to hypoxia (Vaquer-Synyer & Duarte 2008) in late April. Source. Jen Smith, UCSD/SIO and Sam Clements, UCSD/SIO.
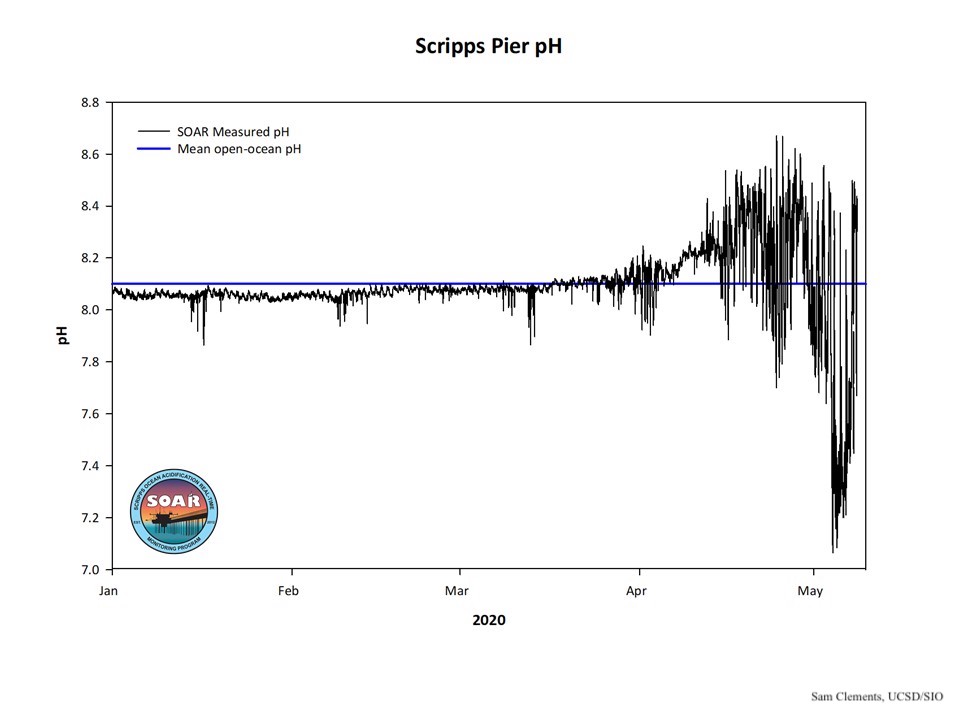
Figure. Data from the SOAR seafet beneath the Scripps Pier shows anomalous pH variability during the red tide bloom. Mean open-ocean pH data sourced from NOAA GFDL Earth System Model. Source. Jen Smith, UCSD/SIO and Sam Clements, UCSD/SIO.
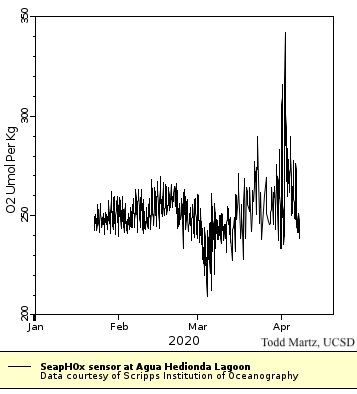
Todd Martz, UCSD/SIO, also has a SeapHOx unit moored in the Agua Hedionda Lagoon near Carlsbad Aquafarm and is measuring for a suite of ocean acidification variables including oxygen. The SeapHOx registered a high oxygen spike in early April just before the battery on the modem died. The day-time max of oxygen production was an indication of high oxygen production by the bloom. The timing of the shutdown is unfortunate and due to COVID-19 restrictions, his lab cannot replace the battery. At this point, the sensor may or may not still be recording and it could also be fouled since it has been out there for several months. The City of San Diego, Public Utilities Department, Ocean Monitoring Program, also monitors for pH, oxygen and other ocean variables to document and analyze possible effects on the marine environment due to the discharge of treated municipal wastewater (i.e. effluent) to the Pacific Ocean via the Point Loma Ocean Outfall (PLOO; Fig. 38) and the South Bay Ocean Outfall (SBOO).
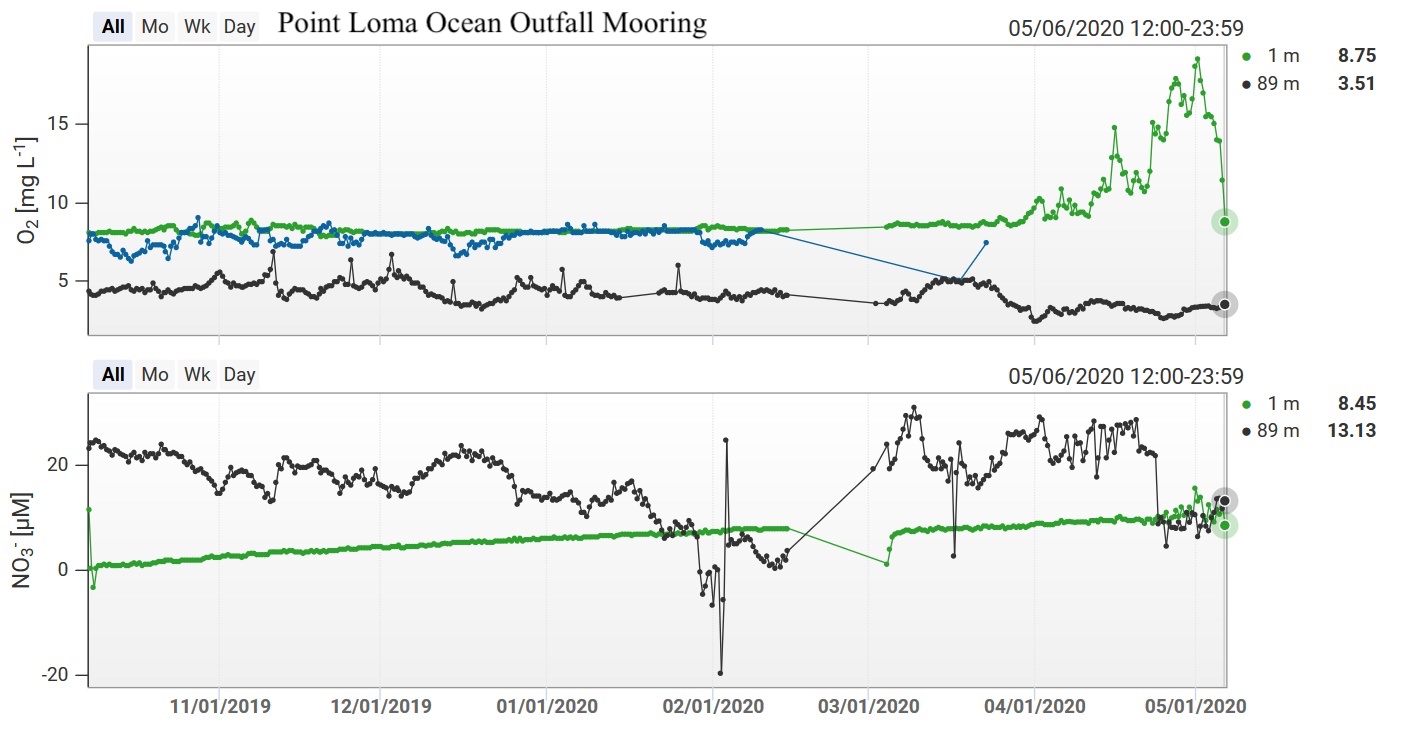
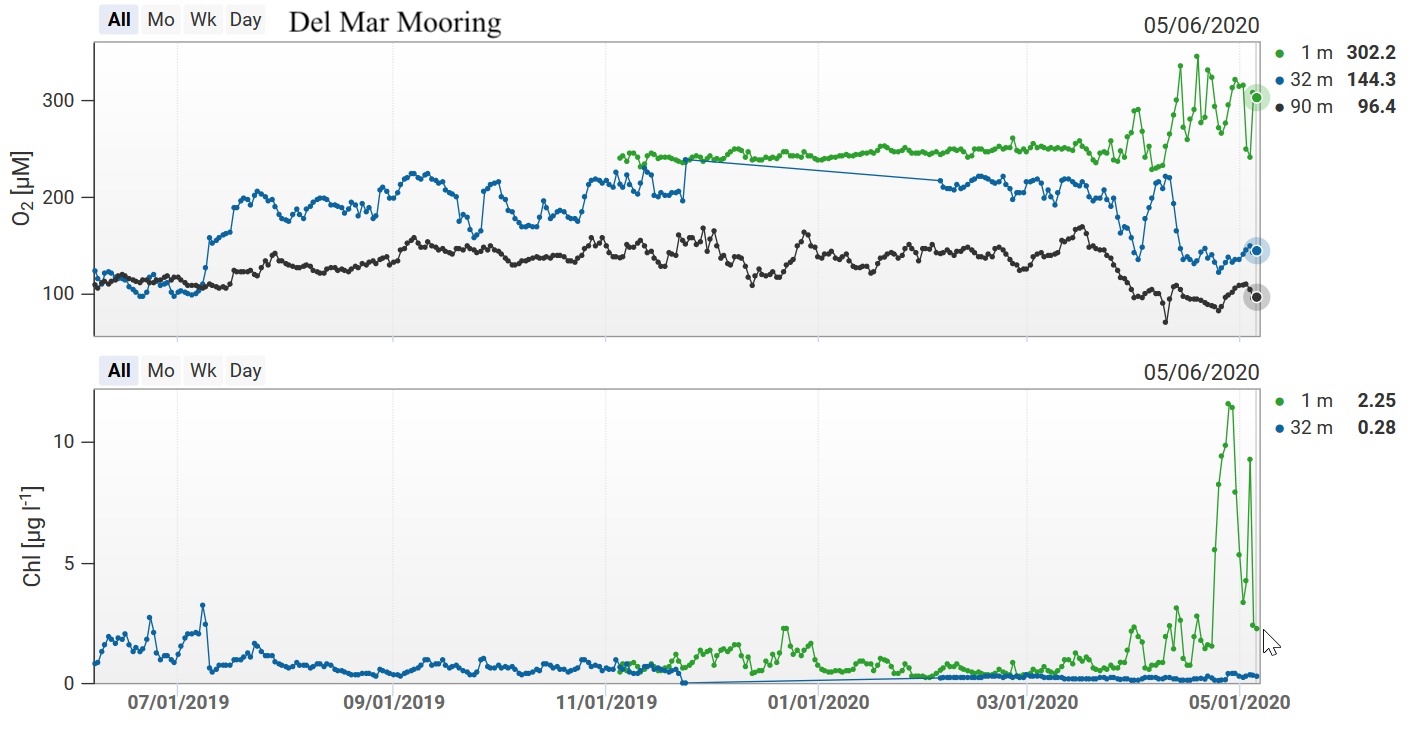
Figure 39. Del Mar mooring Chlorophyll and Oxygen profile at 1 m, 32 m and 90 m from August 2019 to May 6th, 2020. Source: Uwe Send, UCSD/SIO.
Spray Glider - Line 90 off Dana Point
Autonomous underwater gliders observe large-scale upwelling processes on the continental shelf. The California Underwater Glider Network (CUGN) has five active Spray underwater gliders deployed off California's coast. SCCOOS supports glider line 80 and the alongshore line.

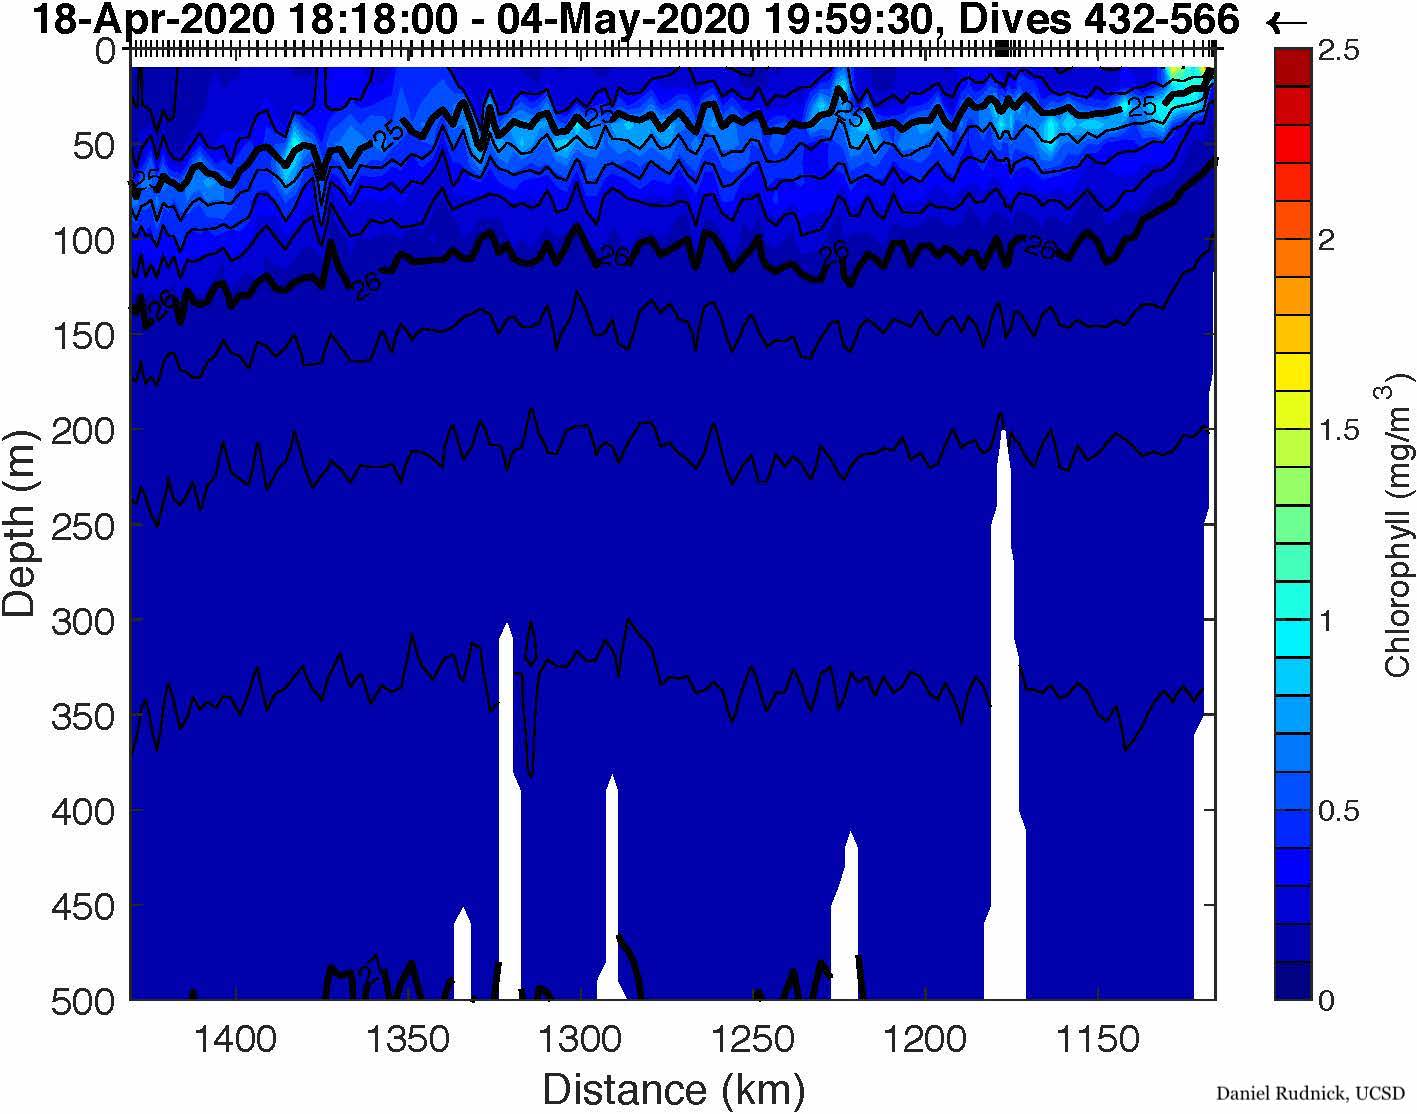
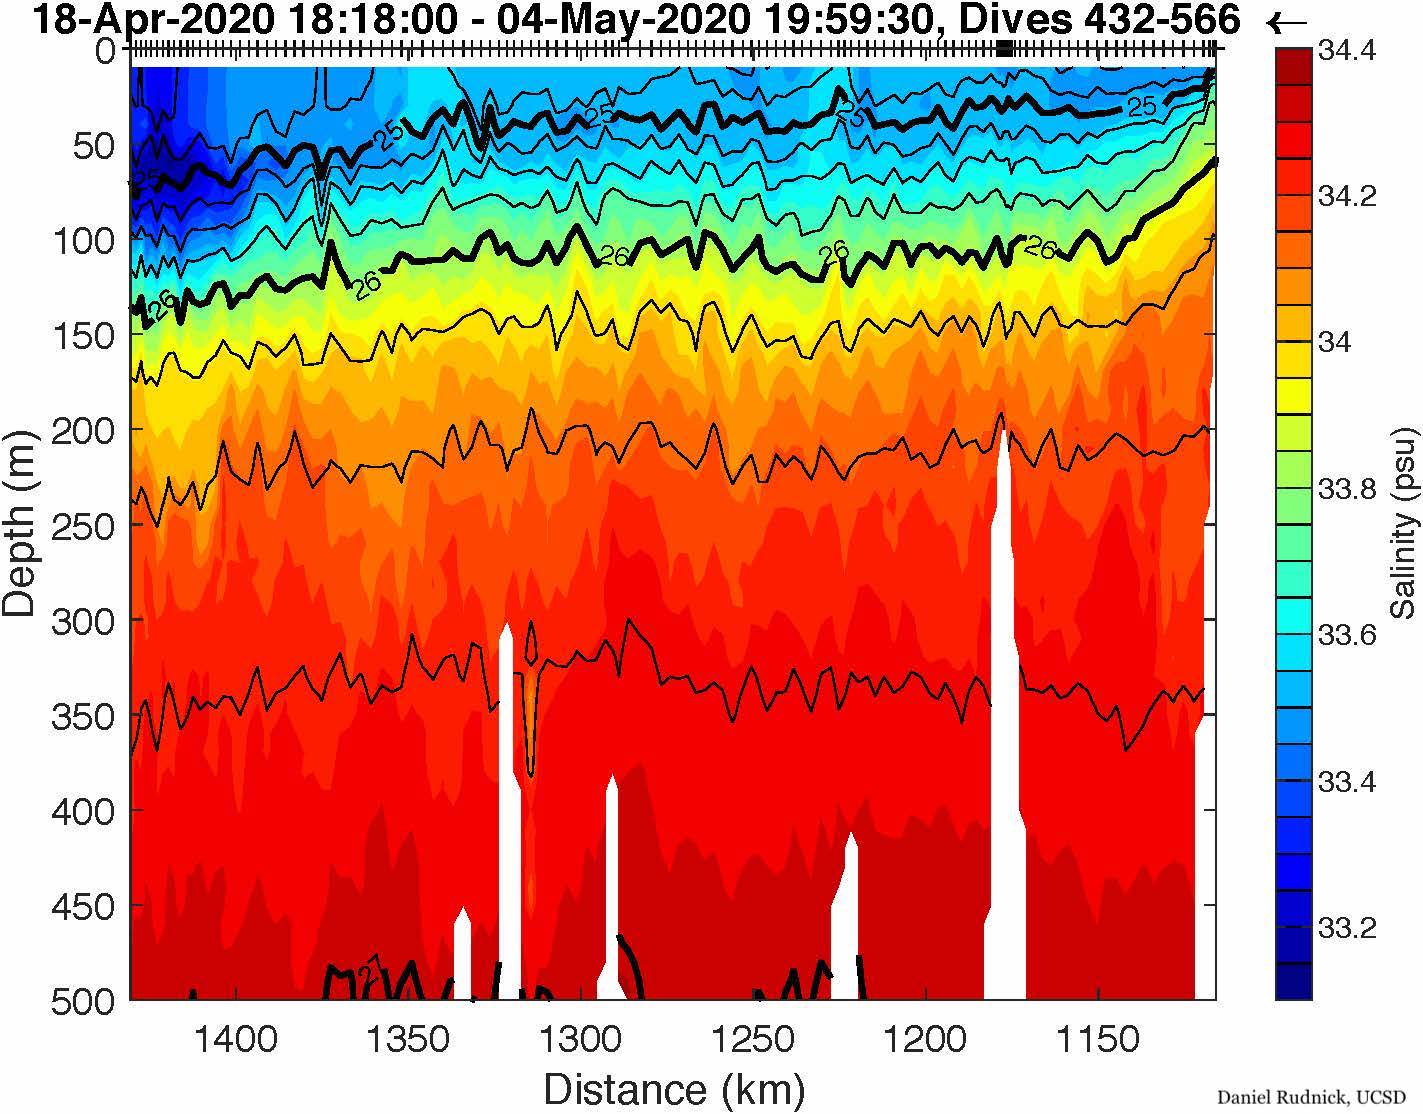
Figure 40-42. Profile plots of Dissolved Oxygen, Chlorophyll, and Salinity from the California Underwater Glider Network spray glider line 90 off Dana Point from April 18th- May 4th, 2020. Please note this is an active glider so there has been no calibration applied yet to oxygen or fluorescence. Source: Daniel Rudnick, UCSD/SIO.
Sea Surface Temperature
Southern California has been experiencing a prolonged marine heatwave since 2015 that has never really gone away. Anomalously warm surface temperatures are common in the region and might be contributing to the spate of “red tides” we have seen in the last few years, as well as the very harmful domoic acid event from Pseudo-nitzschia spp. in 2017. During this year’s red tide, Scripps Pier Manual Shore Station Program (Fig. 45) and CDIPs nearshore Scripps wave buoys (Fig. 46) both identified record highs in sea surface temperature. The Sea Surface Temperature anomalies can also be viewed on NASA Jet Propulsion Laboratory State of the Ocean tool and NOAA, NESDIS Coral Reef Watch.
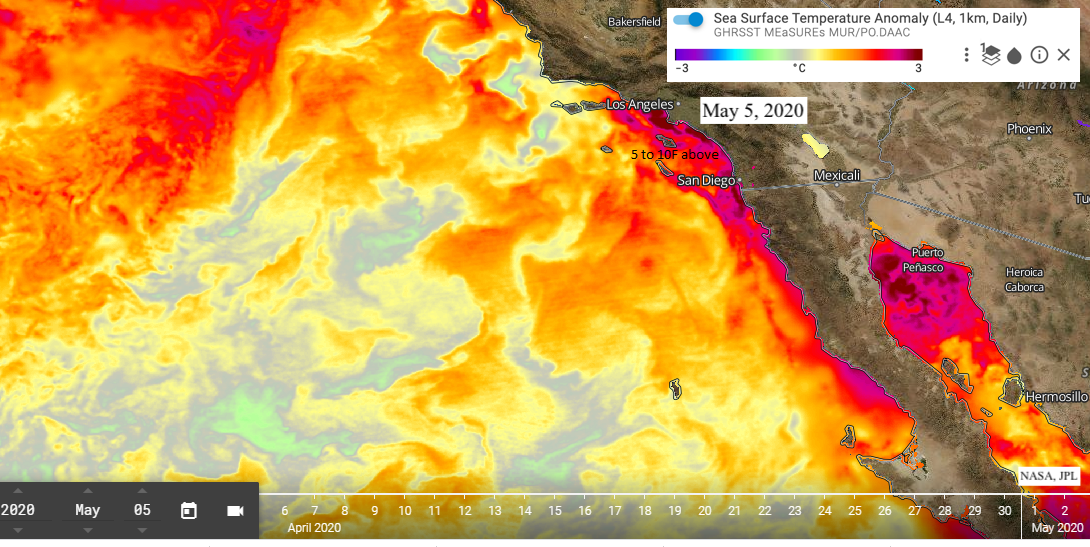

Figure 45. Scripps Pier sea surface temperature measurements. Source: Manual Shore Station Program, California State Parks Division of Boating and Waterways.

Figure 46. Scripps Nearshore Buoy (201) sea surface temperature plot from March 1st, 2020 to May 6th, 2020. Source: Coastal Data Information Program, UCSD/SIO.
Precipitation
March was a very wet month and many have speculated on the role of rain in driving this year’s L. polyedra bloom. It turns out that precipitation was 200-400% above normal levels for Mar-Apr period in Southern California (Fig. 47) and this meant quite a lot of runoff. While L. polyedra blooms do not require runoff to develop and indeed appear to have begun their rapid growth further out on the continental shelf away from the direct influence of discharge plumes, we cannot discount the effect nutrients from land could have in this situation. Nitrate (anthropogenic and natural) and phosphate as well as regenerated forms of nitrogen, such as urea and ammonium, could have helped to keep this bloom cranking, especially as waters warmed and stratification set in.
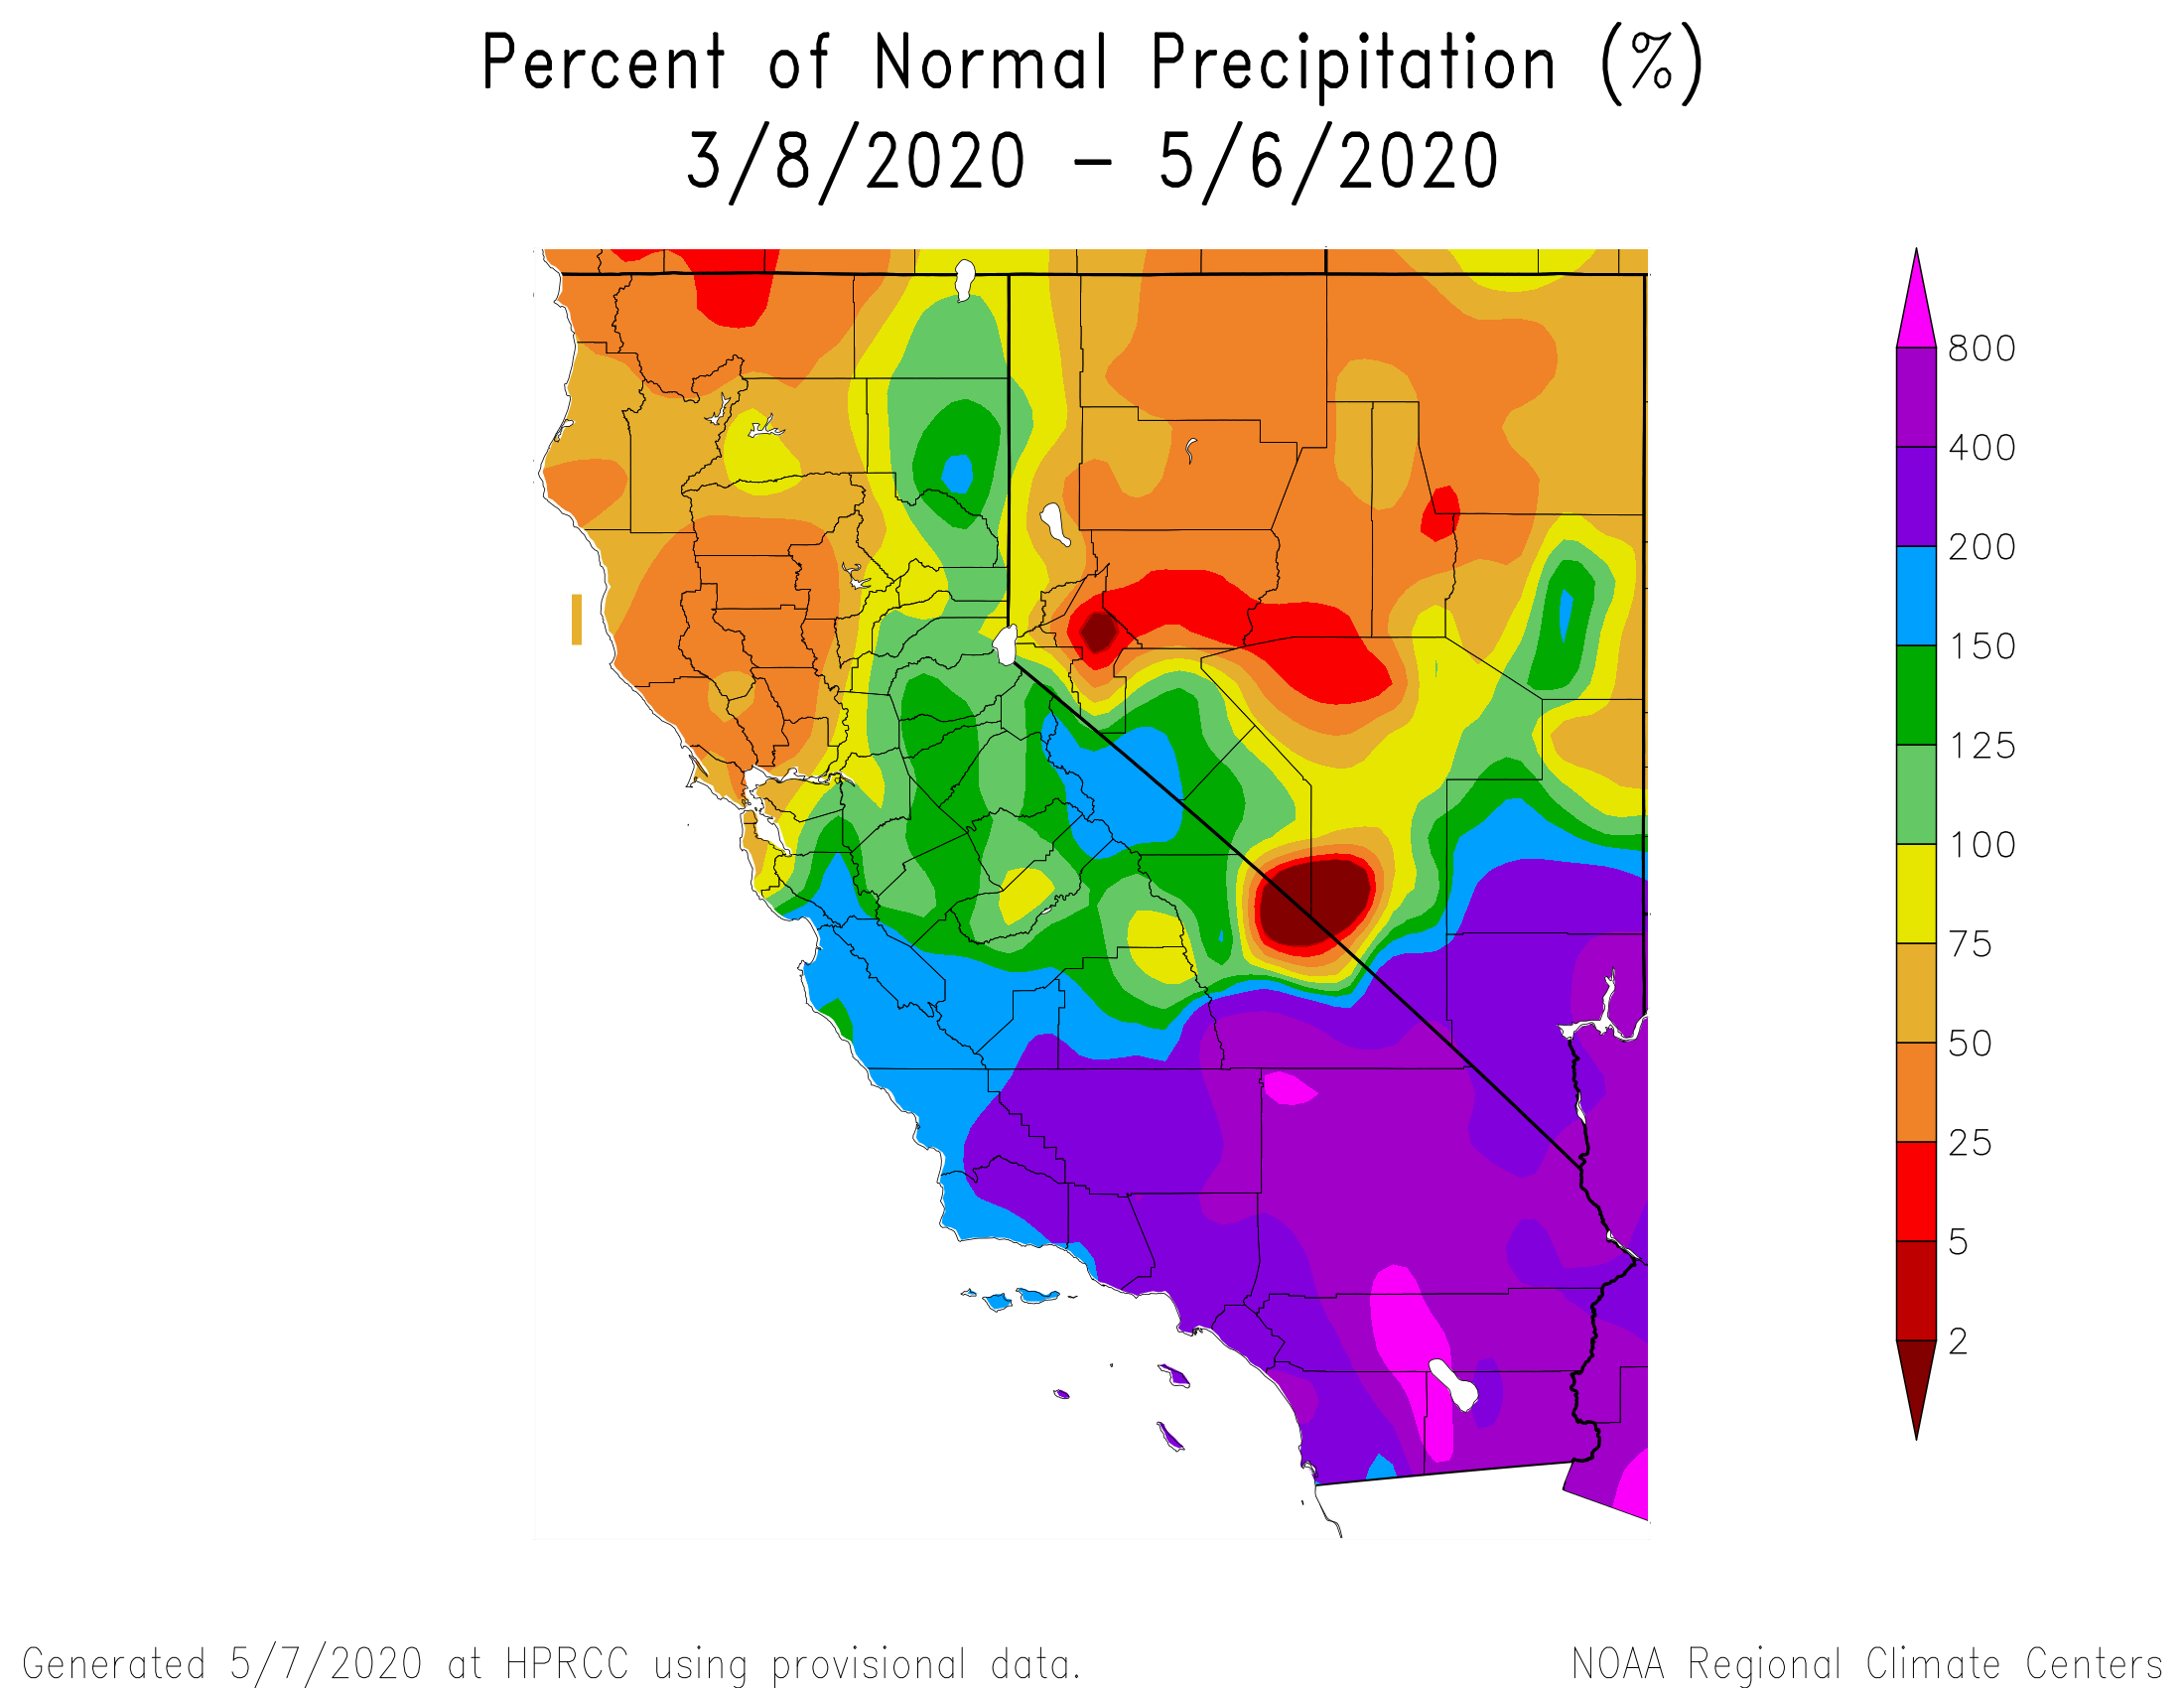

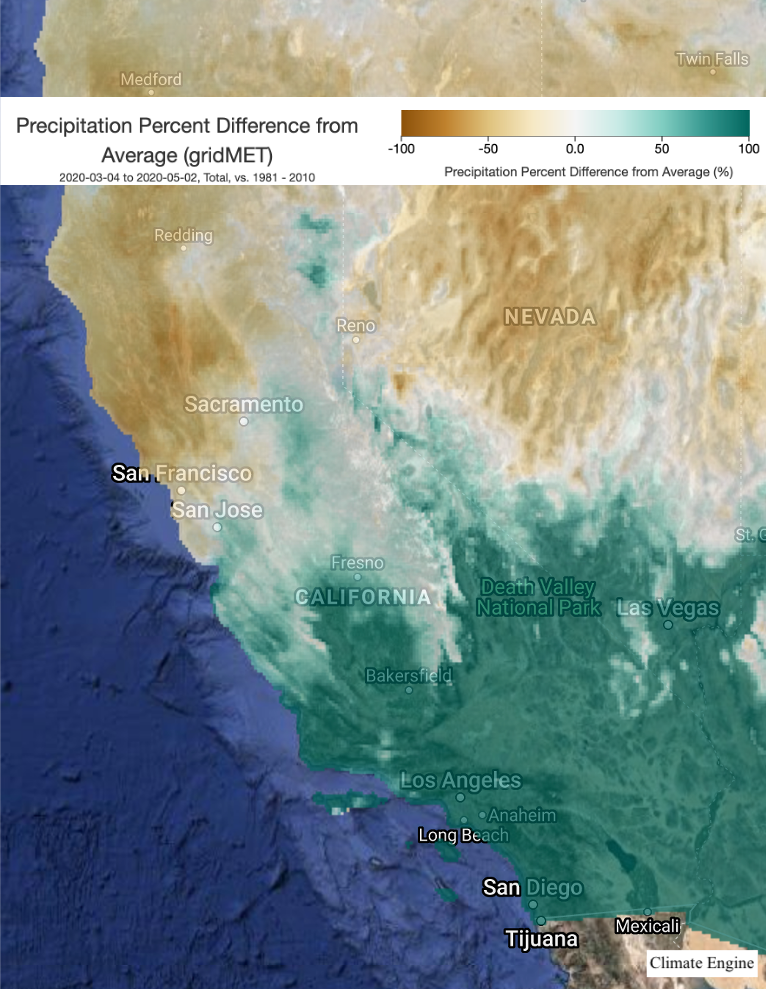
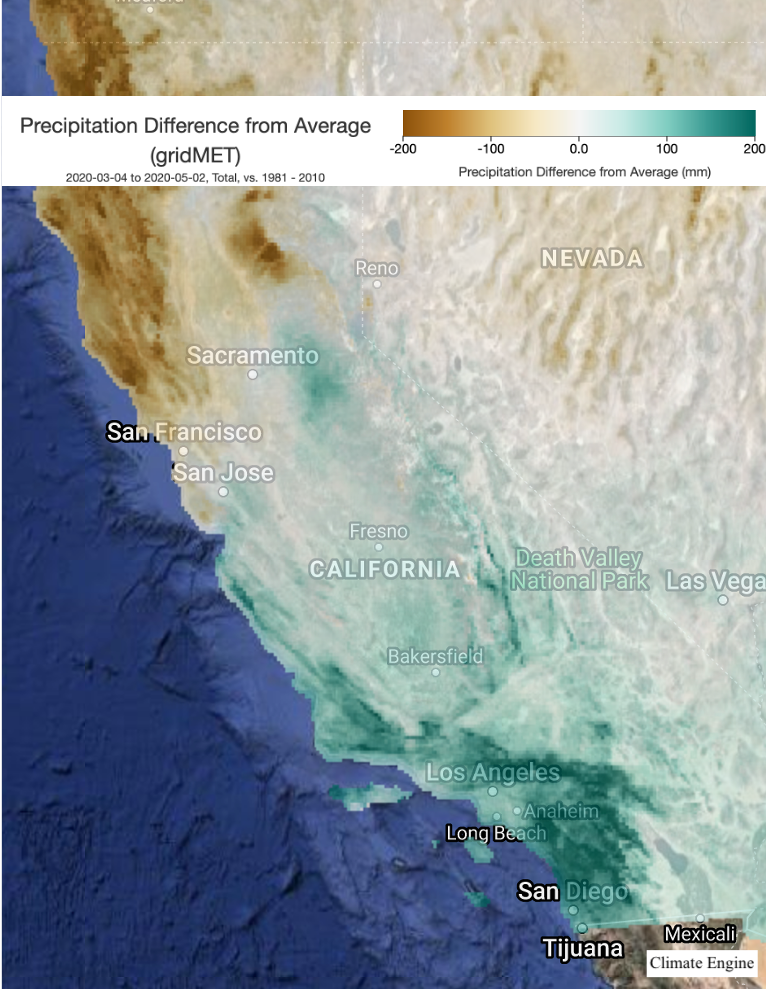
Figure 49. (Left) Precipitation percent difference from average (%) from March 4th, 2020 to May 2nd, 2020. Source: Climate Engine. Figure 50: (Right) Precipitation difference from average (mm) from March 4th, 2020 to May 2nd, 2020. Source: Climate Engine.
Click here to subscribe to the CA HAB Bulletin monthly listserv.
Thank you to everyone that contributed to the Red Tide Bulletin: Spring 2020:
- Carlsbad Aquafarm: Thomas Grimm
- CISESE: Ernesto Garcia Mendoza
- City of Carlsbad: Bailey Chapman, Hallie Thompson, Tim Murphy,
- City of Los Angeles: Mas Dojiri, Curtis Cash, Gregory Deets
- City of Oceanside: Justin Gamble
- City of San Diego: Adrian Feit, Ryan Kempster
- Desert Research Institute: Daniel McEvoy
- NOAA: Toby Garfield, Kerri Danil, Joshua Lonthair, Dale Robinson, Richard Stumpf, Alexander Tardy, Michelle Tomlinson, Nick Wegner
- SCCWRP: Jayme Smith
- SIO/UCSD: Clarissa Anderson, Lanna Cheng, Samantha Clements, Andrew Barton, James Behrens, Melissa Carter, Jimmy Fumo, Megan Hepner-Medina, Julles Jaffe, Mati Kahru, Adi Khen, Michael Latz, Andrea Meinrat, Eric Orenstein, Daniel Rudnick, Kristi Seech, Uwe Send, Jennifer Smith, Todd Martz, Ross Timmerman, and Amanda Timmerman.
- WHOI: Heidi Sosik
- Public: Susan Emrich, Gary Cotter