In February 2017, a cross-border wastewater spill contaminated waters in the Tijuana River Estuary and adjacent coastline, closing beaches from Rosarito MX to Coronado CA and emitting strong odors. This event spurred a series of recommendations to reduce future contamination events and improve notification when events do occur. This event is just one example of many past and ongoing events that have compromised the water quality in the Tijuana River (TJR) and the adjacent coastlines of Playas Tijuana, Imperial Beach, and Coronado.
As part of the Border 2020 project, Scripps Institution of Oceanography PIs, Feddersen and Giddings, conducted hindcast simulations of the 2017 wastewater spill event testing the point source location(s) and duration using realistic atmospheric, tidal, wave, and oceanic forcing. The 2017 model leveraged knowledge gained from the NSF funded Cross Surfzone Inner-shelf Dye Exchange (CSIDE) project. The 2014 modeling capabilities was expanded to include the Tijuana River estuary, cross-border Canyons, and South to Punta Bandera and the San Antonio de los Buenos outfall.
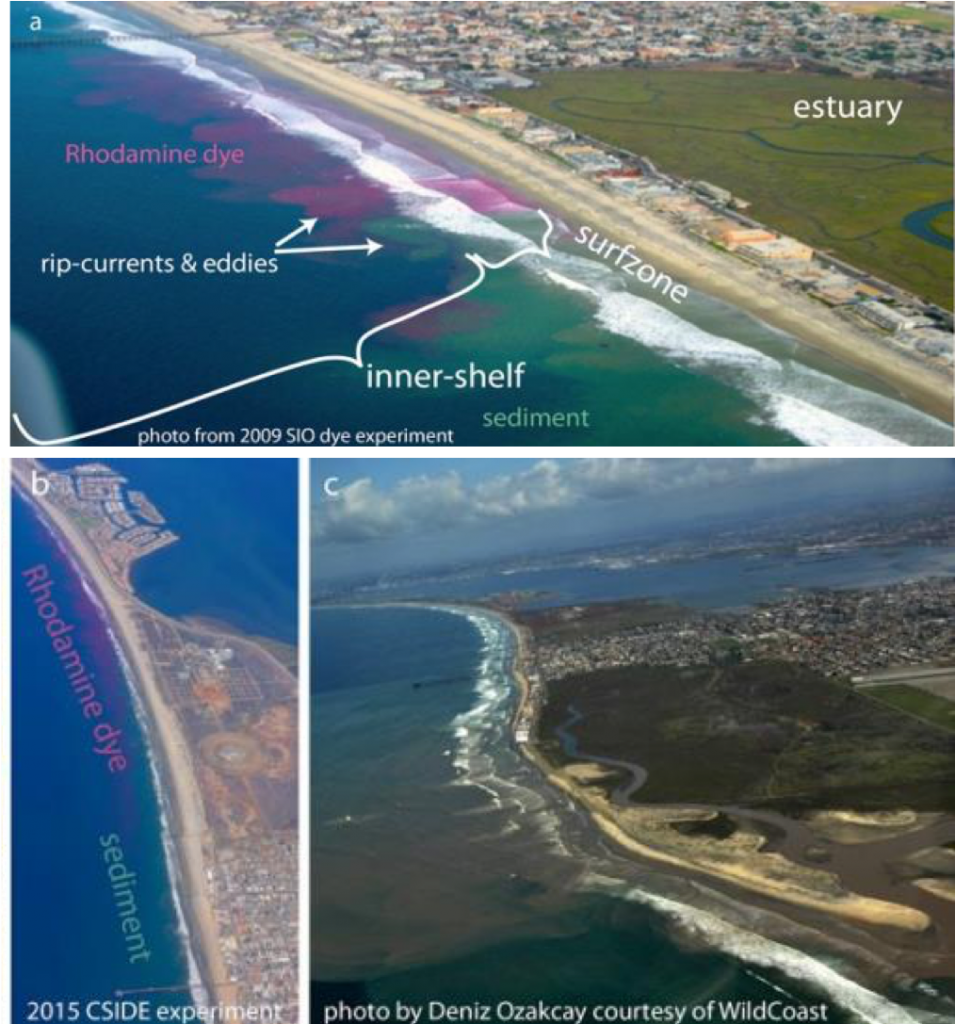
Figure 1. Tijuana and coastal plume images a & b) The top and bottom left images demonstrate how a plume travels up the coastline between the surfzone (where waves break) and the inner-shelf (the shallow-region beyond the surfzone). The plume is visualized via a passive pink dye tracer. c) The bottom right image shows a plume emanating from the Tijuana River.
Model Development
Model development and computer simulations for the 2015 test period as well as the winter 2017 spill event were completed covering the San Diego-Tijuana Border region including the Tijuana River Estuary, San Diego Bay, and the San Antonio de los Buenos outfall 10 km south of the border in Mexico on a new model grid (see Figure 2 below). Model development included grid completion, compilation of the realistic model forcing fields (winds, precipitation, waves, solar heating, etc.), model stability and forcing for the realistic pollution point sources (both freshwater and contaminated inflows), and finally running the simulations on the UCSD Triton Cluster supercomputer.


Figure 2. Model grids for the Level 1-4 (LV1-LV4) nests scaling from the Southern California Bight (LV1) down to the SDTJ Region in the LV4 grid (right). LV4 has horizontal resolution of 100 m at the outer boundaries down to 7 m along the coastline resolving San Diego Bay, the TJRE, the SBOO and Pt. Bandera. Bathymetry is shown in color, LV1-3 validation buoys (left) and point sources (right) are labeled.
Preliminary Results
Movies from the most recent realistic CSIDE simulations on our finest grid (7 – 100 m horizontal resolution) covering the coastline of the US/Mexico border region for Feb-March 2017 can be seen here. These simulations are preliminary hydrodynamic only (no waves yet) simulations with fully realistic oceanic and atmospheric forcing. Additional details and a longer movie result from the BECC 2017 coupled simulations here and here.
DISCLAIMER - Please note that these are hot off the presses and are continuously undergoing validation and improvements. They are not yet meant to be used in a predictive manner. Very importantly, the pollution sources are input as passive tracers - meaning they do not decay and react as real pollutants do (for example decay due to sunlight), thus the tracer visualizations likely represent an upper bound of the concentrations that would result from an actual contaminant spill. Future work is trying to address these issues by incorporating appropriate contaminant behavior for various types of pollutants. Please contact Falk Feddersen or Sarah Giddings with any questions about the simulations.

LV4 Simulation Snapshot

Figure 3. Snapshot from the 2017 spill event LV4 wave-hydrodynamic coupled simulations with passive tracers at sources on 18 February 2017. a) wave height (color) with direction (arrows), b) sea surface temperature with velocity vectors, c) sea surface salinity, d) sea surface concentrations of TJRE and e) Pt. Bandera tracer, cross sections of f) density anomaly and g) both dye tracers at the location indicated in a) with a dashed white line. Note that the tracers enter with a concentration of 1, such that 10-2 indicates 1% of the input concentration remains. Time series of h) sea surface height and i) freshwater and tracer discharge with a black line marking the snapshot time. Freshwater discharge (blue) and tracer flux (red) which is a proxy for the discharge of contaminated water for the Tijuana (filled curves) and for Pt. Bandera (lines). See the disclaimer above regarding the concentration values.
Along-coast tracer analysis

Figure 4. (left) Maximum tracer concentration and (middle) mean tracer concentration versus alongshore distance from the TJRE mouth in km. This includes both TJRE and Pt. Bandera wastewater sources together. Notice the peak at the TJR Estuary mouth. A value of 10-2, or 0.01 implies a 1:100 dilution of wastewater, or 1% remains. right) the fraction of time during the spill event from 12 December 2016 to 31 March 2017 that shoreline tracer concentration exceeds 1:10,000 dilution (blue) and 1:1000 dilution (orange). Distance along the coast is marked marked in kilometers from the Tijuana River mouth and points of interest along the coast are marked with dots including Punta Bandera, the US/Mexico border, The Tijuana River mouth, Imperial Beach (IB) pier, Silver Strand state beach, Hotel del Coronado, and Coronado dog beach.
Importantly, as mentioned above, real contaminants undergo decay, chemical reactions, settling, or other “behavior” which will change their concentration over time that is not included in our current modeling framework. The current modeling framework assumes the dye is a passive tracer meaning that it only undergoes advection and diffusion (i.e., mixing), leading most likely to an upper bound of concentrations (and of exceedance times).
This series of figures included here as well as our additional analyses highlight the following conclusions regarding the 2017 spill as well as potential for historical and future spills:
- Tracers readily extend from the points sources beyond 10 km along the shoreline
- Tracers in the surfzone spread northward along the coast when waves are coming from the south, and southward along the coast when waves are coming from the north as expected due to theory for surfzone currents
- Both Punta Bandera and the Tijuana River are critical point sources to consider when looking at coastal pollution
- Tracers are concentrated in the surfzone, particularly during strong wave conditions, but are exported offshore due to a variety of physical mechanisms (internal tides, winds, submesoscale circulation, etc.)
Data Access
- Specific requests for model output may be sent to ffeddersen@ucsd.edu, sgiddings@ucsd.edu and dgrimes@ucsd.edu
- CSIDE Data Archive
Publications and Documents
Grimes, D.J., Feddersen, F., Giddings, S.N., & Pawlak. G. (2019). Cross-shore Deformation of a Surfzone Released Dye Plume by an Internal Tide on the Inner-shelf. Journal of Physical Oceanography. doi.org/10.1175/JPO-D-19-0046.1.
Feddersen, F., Giddings, S.N. (2019). BECC Quarterly Report, EPA Border 2020 Proposal, RFP SOLTA-C-17-003.
Rodriguez, A. R., Giddings, S. N., & Kumar, N. (2018). Impacts of Nearshore Wave‐Current Interaction on Transport and Mixing of Small‐Scale Buoyant Plumes. Geophysical Research Letters, 45(16), 8379-8389. doi.org/10.1029/2018GL078328.
Feddersen, F., Giddings, S.N. Evaluating the 2017 Tijuana River Estuary cross-border wastewater spill sources and coastal impacts. BECC Work Plan, EPA Border 2020 Proposal, RFP SOLTA-C-17-003.