
March-April, 2026
Summary written by Dr. Kasia Kenitz & Dr. Clarissa Anderson on June 16, 2026
- SUMMARY: March and April 2026 brought two distinct waves of Pseudo-nitzschia activity along the California coast, separated by a brief period of reduced activity in late March and early April. The first wave struck in early March at Southern California stations, with the more toxigenic “seriata” size group exceeding alert threshold* at Scripps Pier (202,808 cells/L on 3/2), Newport Beach (98,753 cells/L on 3/3), and Santa Monica Pier (318,668 cells/L on 3/2), accompanied by particulate domoic acid (pDA) detections ranging from 38 to 178 ng/L across these sites in early March. By mid-March, abundances dropped sharply in Southern California and activity shifted northward, with Santa Cruz Wharf emerging as the regional hotspot – recording 86,050 cells/L of the “seriata” group on 3/18 and pDA as high as 1,070 ng/L, indicating active toxin production. The second wave emerged in mid-April, spreading across both Southern and Central California stations, with Stearns Wharf and Cal Poly Pier recording peaks in both size groups, and Santa Cruz Wharf ending the month with “seriata” abundances of 60,450 cells/L on 4/29 and pDA of 890 ng/L. IFCB data corroborated both events, with particularly high Pseudo-nitzschia abundances at Scripps Pier in early March and Stearns Wharf in late April, while dinoflagellates dominated the HAB community through much of the intervening period. Alexandrium was largely absent or rare statewide but maintained a low persistent presence at Cal Poly Pier and Santa Cruz Wharf, broadly consistent with above-alert PSP toxin levels measured by CDPH in mussels that prompted CDPH to issue bivalve shellfish health advisories for Marin and San Mateo counties in late March and Sonoma County in early April. A total of 24 stranded marine mammals with suspected DA exposure were reported across the state over the two months. Most of the animals exhibited signs of illness believed to reflect more of a chronic rather than acute pattern of toxicity.
IMPORTANT NOTE: Pseudo-nitzschia activity has intensified dramatically along the Central California coast in May and June, with levels far exceeding those observed during the March–April period reported here. Santa Cruz reported “seriata” size group abundance at exceptional levels of 2,245,440 cells/L on 5/27 – the highest concentrations ever reported for this size group at any monitoring site along the California coast. Also, very high DA levels were measured in the biological samples of two humpback whales that stranded on Monterey Bay beaches during this HAB event — see press release (https://news.ucsc.edu/2026/06/dead-whales-domoic-acid/)
* Pseudo-nitzschia alert threshold: 10,000 cells/L. Particulate domoic acid (pDA) alert threshold: 500 ng/L.
- C-HARM predicted elevated probabilities of Pseudo-nitzschia exceeding alert thresholds across much of Central and Northern California – both nearshore and offshore – through March and April, with these regions lighting up as persistent hotspots particularly in the second half of March. Narrow coastal bands of elevated Pseudo-nitzschia risk were also predicted for the Southern California Bight. Risk briefly subsided in mid-April before returning strongly to nearshore waters along much of the California coast by the end of the month. For cellular domoic acid (cDA), highest risk was concentrated in nearshore and offshore Central California, with low risk through much of the Southern California Bight and a notable hotspot in coastal Humboldt Bay at the end of March. Particulate DA (pDA) risk (>500 ng/L) remained elevated through the Southern California Bight for much of March and April; the highest pDA risk in early March was concentrated along the coast from Santa Cruz up to Humboldt Bay, subsided in the nearshore during the second half of March and early April, then expanded again across much of the California coast – both offshore and nearshore – through the second half of April.
- Weekly HABMAP sampling of phytoplankton showed that early March brought a significant wave of Pseudo-nitzschia activity at Southern California stations. The more toxigenic “seriata” size group drastically exceeded alert thresholds at Scripps Pier (202,808 cells/L on 3/2), Newport Beach (98,753 cells/L on 3/3), and Santa Monica Pier (318,668 cells/L on 3/2), with the “delicatissima” size group also reaching striking levels — 592,142 cells/L at Scripps Pier on 3/2 and 161,124 cells/L at Newport Pier on 3/3. Elevated pDA was also detected across Southern California stations – 178 ng/L at Scripps Pier, 170 ng/L at Newport Beach, and 38 ng/L at Santa Monica Pier – underscoring the toxic nature of this bloom. By mid-March, abundances dropped sharply in Southern California and the focus shifted north. Santa Cruz Wharf recorded “seriata” size group concentrations of 36,700 cells/L on 3/11 and 86,050 cells/L on 3/18, and here the DA followed – pDA reached 690 ng/L on 3/11 and 1,070 ng/L on 3/18, indicating active toxin production. Cal Poly Pier also exceeded alert thresholds for the “seriata” group on 3/18 (17,592 cells/L), with pDA detected throughout much of March (40-60 ng/L from 3/9 to 3/23). Pseudo-nitzschia remained below alert thresholds through early April before picking up again in mid-month. Newport Pier was the first to exceed alert levels for the “seriata” group (20,790 cells/L on 4/15), followed by Cal Poly Pier (32,517 cells/L on 4/19) and Stearns Wharf (40,240 cells/L on 4/20), where pDA reached 100 ng/L. The “delicatissima” group peaked around the same time, reaching 151,393 cells/L at Cal Poly Pier on 4/19 and 151,410 cells/L at Stearns Wharf on 4/20. Abundances continued to build through late April, with the highest “seriata” levels recorded at Santa Monica Pier (44,880 cells/L on 4/27) and Santa Cruz Wharf (60,450 cells/L on 4/29), and peak “delicatissima” at Santa Monica (90,882 cells/L on 4/27). At Santa Cruz, pDA surged back to 890 ng/L on 4/29, closely tracking the return of elevated cell counts at that station.
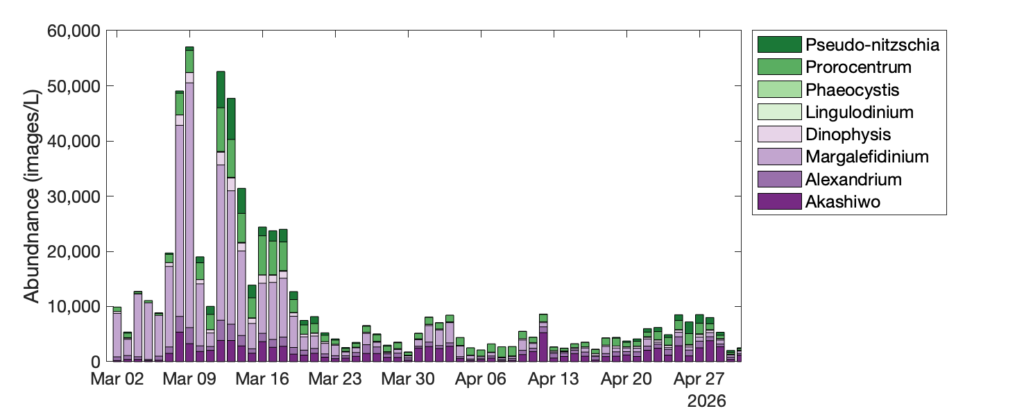
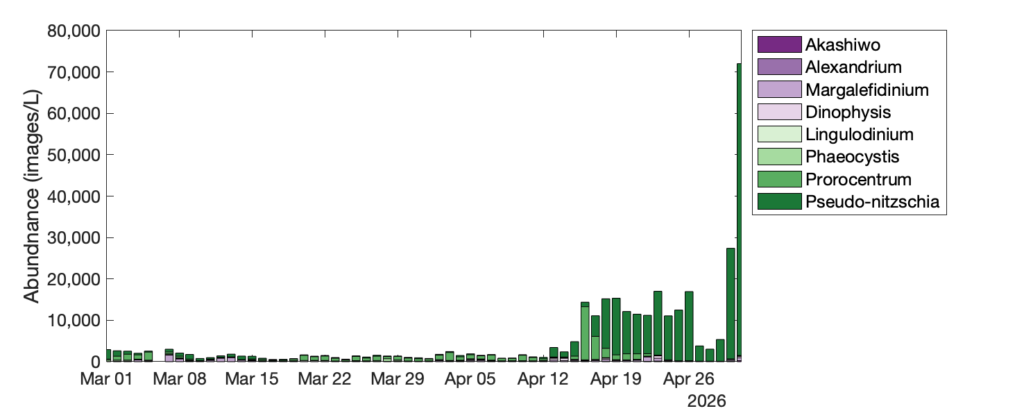
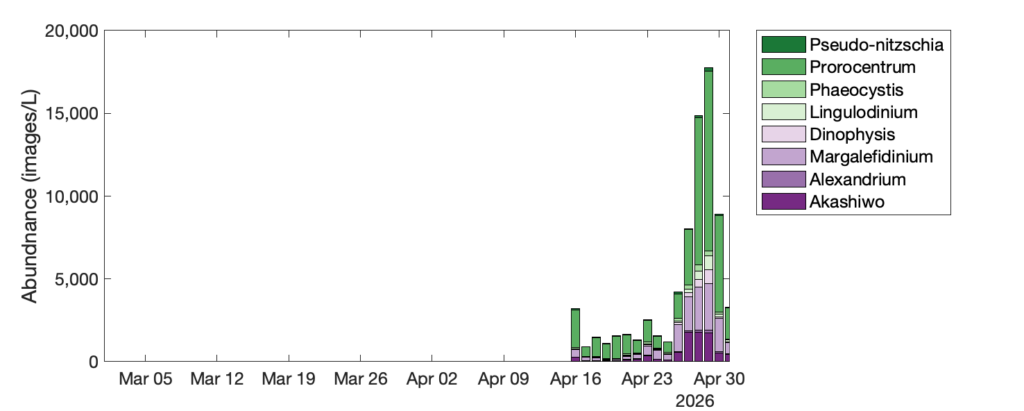
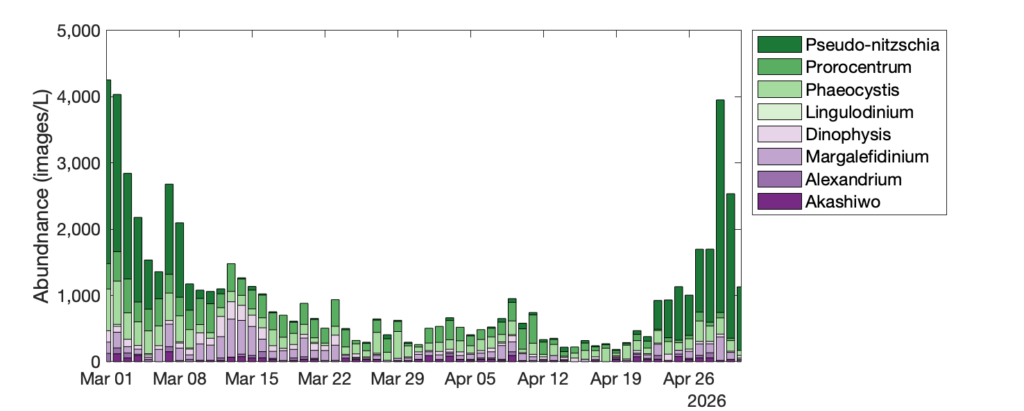
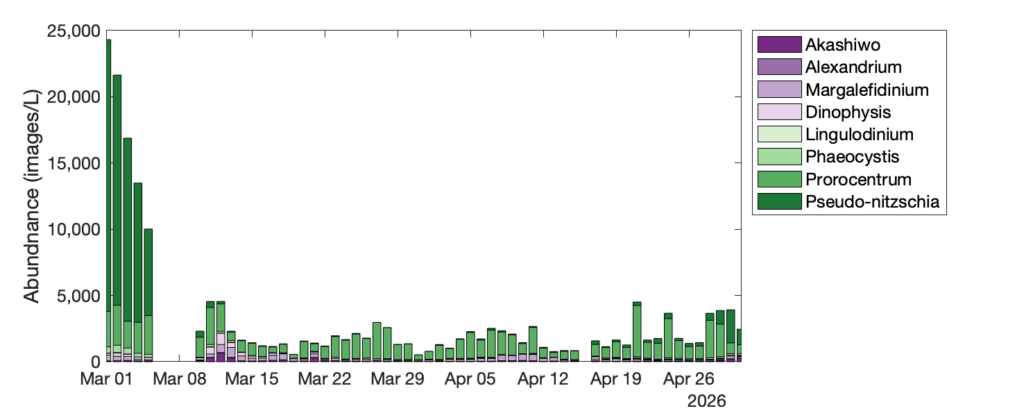
Alexandrium was largely absent or rare across most HABMAP monitoring sites in March and April. Cal Poly Pier and Santa Cruz Wharf were the exception, with low but persistent detections through much of the period. At Cal Poly Pier, concentrations briefly spiked to 2,131 cells/L on 3/29 before settling around 500 cells/L through April. Santa Cruz Wharf followed a similar pattern, peaking at 850 cells/L in mid-March, declining through early April, then increasing again to 830 cells/L at the end of the month. These detections are broadly consistent with the above-alert PSP toxin levels reported by CDPH in mussels and subsequent bivalve advisories for Marin and San Mateo (3/30), and Sonoma (4/9) counties around the same time, and a later exceedance in mussels from Del Norte County (4/23). There were also detections of PSP toxins in mussels below the alert level in the remaining Northern California counties sampled in April (Humboldt, Mendocino, Contra Costa, San Francisco, San Mateo, Santa Cruz, and Monterey). - The data collected by Imaging Flow Cytobots (IFCBs) – robotic microscopes – broadly corroborate HABMAP observations. At Scripps Pier, Pseudo-nitzschia reached up to 20,000 images/L in early March, consistent with the exceptionally high abundances recorded by HABMAP at that time. At Santa Cruz Wharf, IFCB data captured a notable rise in Pseudo-nitzschia between 3/12–14, with abundances reaching approximately 15,000 images/L (roughly 30,000–45,000 cells/L). Despite these localized Pseudo-nitzschia peaks, dinoflagellates — particularly Prorocentrum, Margalefidinium and Akashiwo — dominated the HAB community through much of March and April across IFCB monitoring sites. Del Mar recorded a relatively modest uptick in Pseudo-nitzschia in the first half of March and again in the second half of April. The most striking late-season IFCB signal came from Stearns Wharf, where Pseudo-nitzschia abundances surged over the second half of April, reaching up to 30,000 images/L (roughly 60,000–90,000 cells/L), consistent with the alert-level HABMAP counts recorded at that station.
- Marine Mammal Strandings associated with suspected DA exposure remained relatively low across the state – a total of 24 animals – during March and April combined. Southern California accounted for 9 cases (Los Angeles County: 6, Orange County: 3, San Diego County: 0), while Central California recorded 15 cases (San Luis Obispo County: 12, Santa Cruz County: 2, Monterey County: 1). Strandings were notably lower in March, with 7 cases reported – all from San Luis Obispo County – increasing to 17 cases in April across both Southern and Central California. Most of the animals exhibited signs of illness believed to reflect more of a chronic rather than acute pattern of toxicity, likely associated with long-term neurological damage from past bloom events. At least one case recorded in April for Los Angeles County was tentatively classified as acute toxicity based on body condition, potentially linked to the Pseudo-nitzschia and DA activity observed in Central and Southern California during that period based upon HABMAP observations and C-HARM predictions of elevated DA risk in that region.
- California Department of Public Health (CDPH) Environmental Management Branch conducts its own phytoplankton monitoring and molluscan bivalve shellfish testing for PSP toxins and DA. CDPH phytoplankton monitoring detected Pseudo-nitzschia at “present” or “common” levels across much of the California coast in both March and April. Alexandrium was largely absent or rare along the coast in March; however, CDPH detected above-alert PSP toxin levels in mussels from Marin County (502 µg/100g on 3/24) and San Mateo County (280 µg/100g on 3/26), triggering bivalve shellfish health advisories for those areas on 3/30. In April, Alexandrium was detected at “present” levels in San Mateo, Santa Cruz, and Santa Barbara counties. On April 9, CDPH issued an advisory warning the public not to consume sport-harvested mussels, clams, scallops, or oysters from Sonoma County due to dangerous levels of PSP toxins detected in mussels from those waters. Above-alert PSP toxin levels were detected in Del Norte County on 4/23 (114 µg/100g), prompting CDPH to issue a bivalve shellfish advisory for the county on 5/1.
** Currently, CDPH is advising the public not to consume sport-harvested mussels, clams, scallops, or oysters from Del Norte County due to dangerous levels of PSP toxins detected in shellfish from those waters. The recreational razor clam fishery remains closed in Humboldt County because of elevated levels of domoic acid. Advisories previously in effect for Marin, San Mateo, and Sonoma counties have been lifted. Additionally, the annual statewide mussel quarantine for sport-harvested mussels along the entire California coast is now in effect as of May 1.
For current bivalve shellfish advisories please see the CDPH advisory map:
https://experience.arcgis.com/experience/394836318cfe4f7494e1c09097a43559
- SUMMARY: March and April 2026 brought two distinct waves of Pseudo-nitzschia activity along the California coast, separated by a brief period of reduced activity in late March and early April. The first wave struck in early March at Southern California stations, with the more toxigenic “seriata” size group exceeding alert threshold* at Scripps Pier (202,808 cells/L on 3/2), Newport Beach (98,753 cells/L on 3/3), and Santa Monica Pier (318,668 cells/L on 3/2), accompanied by particulate domoic acid (pDA) detections ranging from 38 to 178 ng/L across these sites in early March. By mid-March, abundances dropped sharply in Southern California and activity shifted northward, with Santa Cruz Wharf emerging as the regional hotspot – recording 86,050 cells/L of the “seriata” group on 3/18 and pDA as high as 1,070 ng/L, indicating active toxin production. The second wave emerged in mid-April, spreading across both Southern and Central California stations, with Stearns Wharf and Cal Poly Pier recording peaks in both size groups, and Santa Cruz Wharf ending the month with “seriata” abundances of 60,450 cells/L on 4/29 and pDA of 890 ng/L. IFCB data corroborated both events, with particularly high Pseudo-nitzschia abundances at Scripps Pier in early March and Stearns Wharf in late April, while dinoflagellates dominated the HAB community through much of the intervening period. Alexandrium was largely absent or rare statewide but maintained a low persistent presence at Cal Poly Pier and Santa Cruz Wharf, broadly consistent with above-alert PSP toxin levels measured by CDPH in mussels that prompted CDPH to issue bivalve shellfish health advisories for Marin and San Mateo counties in late March and Sonoma County in early April. A total of 24 stranded marine mammals with suspected DA exposure were reported across the state over the two months. Most of the animals exhibited signs of illness believed to reflect more of a chronic rather than acute pattern of toxicity.
Particulate Domoic Acid
Particulate domoic acid (pDA) is the measurement of total domoic acid toxin that is potentially extant in a given area. This forecast provides a probability for where that concentration of toxin is predicted to exceed the threshold that classifies a Harmful Algal Bloom (> 500 nanograms per Liter).
The C-HARM v4 model generates nowcast and forecasts of the probability of Pseudo-nitzschia concentrations of in excess of 10,000 cells/L, the probability of particulate domoic acid > 500 nanograms/L, and the probability of cellular domoic acid > 10 picograms/cell in California and Southern Oregon coastal waters. Inputs for the model include near real-time satellite observations, gap-filled chlorophyll a, 486nm reflectance, and 551nm reflectance fields from the S-NPP NOAA VIIRS sensor plus nowcast and forecast data of surface salinity, sea surface temperature, and surface currents from WCOFS ROMS.
Cellular Domoic Acid
Cellular domoic acid (cDA) is the measure of total domoic acid toxin calculated per cell of Pseudo-nitzschia. This forecast provides a probability for where those cells are expected to be producing toxin at high levels (> 10 picograms per cell).
The C-HARM v4 model generates nowcast and forecasts of the probability of Pseudo-nitzschia concentrations of in excess of 10,000 cells/L, the probability of particulate domoic acid > 500 nanograms/L, and the probability of cellular domoic acid > 10 picograms/cell in California and Southern Oregon coastal waters. Inputs for the model include near real-time satellite observations, gap-filled chlorophyll a, 486nm reflectance, and 551nm reflectance fields from the S-NPP NOAA VIIRS sensor plus nowcast and forecast data of surface salinity, sea surface temperature, and surface currents from WCOFS ROMS.
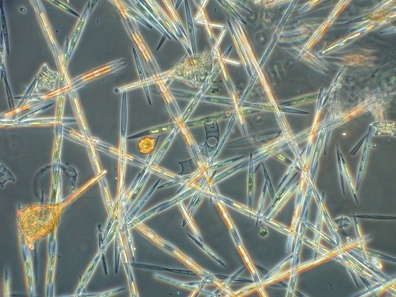
Pseudo-nitzschia
Pseudo-nitzschia is a neurotoxin producing diatom that is observed along the California Coast. Blooms of this phytoplankton can be detrimental to surrounding marine ecosystems. This forecast provides a probability for where the concentration of cells in the water exceed the threshold of a Harmful Algal Bloom ( > 10,000 cells/L).
The C-HARM v4 model generates nowcast and forecasts of the probability of Pseudo-nitzschia concentrations of in excess of 10,000 cells/L, the probability of particulate domoic acid > 500 nanograms/L, and the probability of cellular domoic acid > 10 picograms/cell in California and Southern Oregon coastal waters. Inputs for the model include near real-time satellite observations, gap-filled chlorophyll a, 486nm reflectance, and 551nm reflectance fields from the S-NPP NOAA VIIRS sensor plus nowcast and forecast data of surface salinity, sea surface temperature, and surface currents from WCOFS ROMS.
California Harmful Algal Bloom Monitoring & Alert Program
Differentiating Pseudo-nitzschia species by light microscopy is difficult. For this reason, Pseudo-nitzschia “seriata” does not refer to an actual species but rather the larger size class of Pseudo-nitzschia, which is generally a more toxigenic group of species. Alternatively, Pseudo-nitzschia “delicatissima” refers to the smaller size class that is generally non-toxigenic. The dashed line on the plots demarcates the 10,000 cells/L “bloom” threshold designated here for Pseudo-nitzschia populations only.
Data for some stations are not shown as they are not yet recorded in the public HABMAP archive.
Note for Google Chrome users:
There is a known issue rendering the HABMAP plot. Data can be viewed in alternative browsers.
These time series focus on data collected through the scope of this bulletin and the 12 month period that precedes it. Explore the variables and regions that make up the CalHABMAP collective dataset using the plot controls.
More information and data visualizations on the statewide HAB network and forecasting system is found on the California HABMAP website and on the SCCOOS Harmful Algal Bloom page.
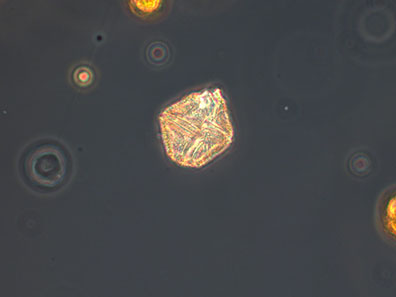
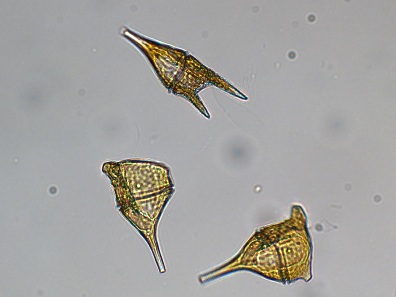
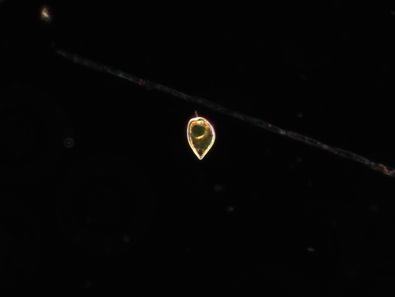
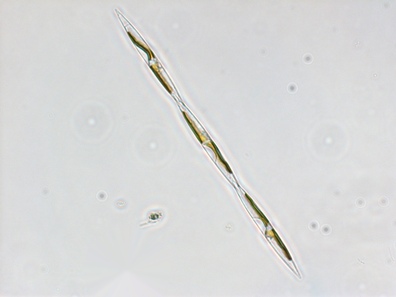
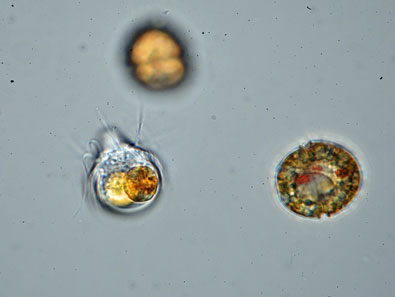
A network of Imaging FlowCytobots (IFCBs) continuously photographs particles, such as plankton, in the water. Using machine learning, plankton species can be automatically identified. This will help improve the ability to detect and respond to Harmful Algal Blooms, including the ability to assess conditions that may lead to toxin production or blooms of toxin-producing algae.
These data, coupled with the image classification algorithms developed in collaboration with SCCOOS and CeNCOOS, allow for estimates of species composition over time. The time series below depict sampling outcomes across several California sites. Support provided by NOAA IOOS and CA OPC.
Additional images and data are available on the IFCB dashboard.
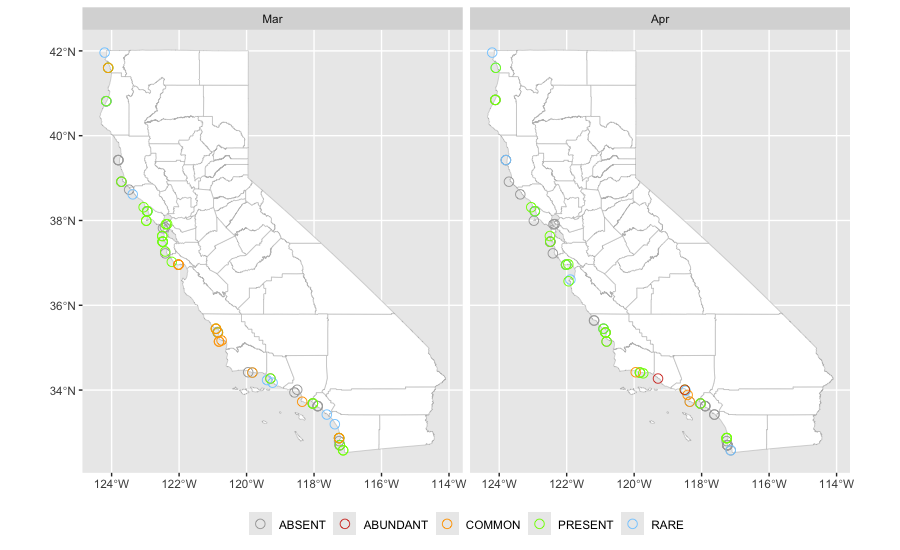
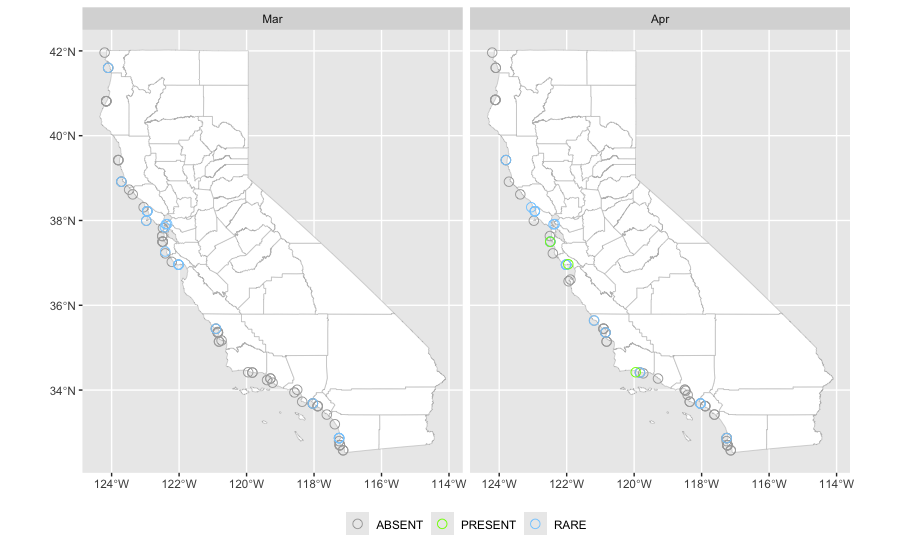
Each month, water samples are collected by volunteers and sent to the California Department of Public Health (CDPH) for analysis. The relative abundance of DA-producing Pseudo-nitzschia ‘seriata’ size class (upper) and PSP toxin-producing Alexandrium spp. (lower) are catalogued from sample locations within each county.
____
CDPH is advising the public not to eat sport-harvested mussels, clams, scallops, or oysters, gathered from Marin and San Mateo Counties due to dangerous levels of paralytic shellfish poisoning toxins detected.
____
CDPH is advising the public not to eat sport-harvested mussels, clams, scallops or oysters gathered from Sonoma County due to dangerous levels of paralytic shellfish poisoning toxins detected.
Percent composition categories help us look at phytoplankton trends across an entire region to evaluate risk of biotoxin presence. Many other factors contribute to our evaluation of risk in an area. These samples are posted for informational purposes only. They are not intended to inform the public of the presence or lack of risk. For the latest health advisory information, see the CDPH Health Advisory Map below.
Water Sample Detailed Data
| Date_Sampled | Sample_Site | Latitude | Longitude | PN_Percent_Comp | PN_Density | AL_Percent_Comp | AL_Density |
|---|---|---|---|---|---|---|---|
| 2026-03-04 | Morro Bay, North T-Pier | 35.37027 | -120.8577 | 0 | ABSENT | 0 | ABSENT |
| 2026-03-03 | San Luis Obispo, Cal Poly Pier | 35.16949 | -120.74082 | 10 | COMMON | 0 | ABSENT |
| 2026-03-06 | Point Richmond, Ferry Point | 37.90901 | -122.39105 | 3 | PRESENT | 0.5 | RARE |
| 2026-03-09 | Drakes Bay, Chimney Rock LBS | 37.99481 | -122.97327 | 1 | PRESENT | 0.5 | RARE |
| 2026-03-09 | Humboldt Bay, Indian Is. Ch. | 40.81371 | -124.15952 | 0 | ABSENT | 0 | ABSENT |
| 2026-03-09 | Tomales Bay, Lease #M430-15 | 38.2176 | -122.9437 | 0 | ABSENT | 0.5 | RARE |
| 2026-03-09 | Morro Bay, Boat Launch | 35.35703 | -120.85021 | 0.5 | RARE | 0 | ABSENT |
| 2026-03-04 | Goleta Pier | 34.41287 | -119.82814 | 0.5 | RARE | 0 | ABSENT |
| 2026-03-04 | Santa Cruz Wharf | 36.95739 | -122.01764 | 0 | ABSENT | 0 | ABSENT |
| 2026-03-02 | Humboldt Bay, Indian Is. Ch. | 40.81371 | -124.15952 | 0 | ABSENT | 0 | ABSENT |
| 2026-03-02 | Tomales Bay, Lease #M430-15 | 38.2176 | -122.9437 | 0.5 | RARE | 0 | ABSENT |
| 2026-03-02 | Point Arena Pier | 38.9147 | -123.71124 | 0 | ABSENT | 0 | ABSENT |
| 2026-03-03 | Ventura, Channel Is. Harbor | 34.17378 | -119.22913 | 0.5 | RARE | 0 | ABSENT |
| 2026-03-04 | Imperial Beach Pier | 32.57962 | -117.13742 | 2 | PRESENT | 0 | ABSENT |
| 2026-03-04 | San Diego Bay, U.S. Navy Pier | 32.7 | -117.236 | 5 | PRESENT | 0 | ABSENT |
| 2026-03-05 | Mendocino, Noyo Harbor | 39.42448 | -123.8008 | 0 | ABSENT | 0 | ABSENT |
| 2026-03-06 | Bolsa Chica | 33.68344 | -118.03494 | 3 | PRESENT | 0.5 | RARE |
| 2026-03-07 | Ventura Pier | 34.27208 | -119.29275 | 8 | PRESENT | 0 | ABSENT |
| 2026-03-02 | La Jolla, Scripps Pier | 32.86716 | -117.25759 | 11 | COMMON | 0.5 | RARE |
| 2026-03-13 | San Francisco Bay, Golden Gate | 37.81842 | -122.47815 | 0 | ABSENT | 0 | ABSENT |
| 2026-03-13 | San Francisco Bay | 37.8398 | -122.4196 | 0 | ABSENT | 0.5 | RARE |
| 2026-03-16 | Morro Bay, Boat Launch | 35.35703 | -120.85021 | 0.5 | RARE | 0 | ABSENT |
| 2026-03-16 | Tomales Bay, Lease #M430-15 | 38.2176 | -122.9437 | 0.5 | RARE | 0.5 | RARE |
| 2026-03-16 | Humboldt Bay, Indian Is. Ch. | 40.81371 | -124.15952 | 0.5 | RARE | 0 | ABSENT |
| 2026-03-11 | Santa Cruz Wharf | 36.95739 | -122.01764 | 20 | COMMON | 0.5 | RARE |
| 2026-03-09 | La Jolla, Scripps Pier | 32.86716 | -117.25759 | 10 | COMMON | 0.5 | RARE |
| 2026-03-16 | Point Arena Pier | 38.9147 | -123.71124 | 0 | ABSENT | 0 | ABSENT |
| 2026-03-12 | Bean Hollow State Beach | 37.2243 | -122.4095 | 0 | ABSENT | 0 | ABSENT |
| 2026-03-31 | Morro Bay, Boat Launch | 35.35703 | -120.85021 | 15 | COMMON | 0 | ABSENT |
| 2026-03-30 | Tomales Bay, Lease #M430-15 | 38.2176 | -122.9437 | 5 | PRESENT | 0.5 | RARE |
| 2026-03-08 | Pillar Point Harbor | 37.49883 | -122.48753 | 1 | PRESENT | 0 | ABSENT |
| 2026-03-28 | Pillar Point Harbor | 37.49883 | -122.48753 | 1 | PRESENT | 0 | ABSENT |
| 2026-03-13 | Bolsa Chica | 33.68344 | -118.03494 | 1 | PRESENT | 0 | ABSENT |
| 2026-03-14 | Cayucos Pier | 35.44647 | -120.90775 | 1 | PRESENT | 0 | ABSENT |
| 2026-03-18 | Santa Cruz Wharf | 36.95739 | -122.01764 | 40 | COMMON | 0.5 | RARE |
| 2026-03-27 | Richmond, Marina Bay Harbor | 37.91386 | -122.35416 | 5 | PRESENT | 0.5 | RARE |
| 2026-03-24 | Drakes Bay, Chimney Rock LBS | 37.99481 | -122.97327 | 5 | PRESENT | 0 | ABSENT |
| 2026-03-26 | Santa Cruz, Davenport Landing | 37.02423 | -122.21606 | 9 | PRESENT | 0 | ABSENT |
| 2026-03-26 | Pescadero State Beach | 37.2673 | -122.41172 | 8 | PRESENT | 0.5 | RARE |
| 2026-03-23 | Morro Bay, Boat Launch | 35.35703 | -120.85021 | 1 | PRESENT | 0 | ABSENT |
| 2026-03-23 | Bodega Harbor, USCG Dock | 38.31277 | -123.0513 | 1 | PRESENT | 0 | ABSENT |
| 2026-03-24 | Pillar Point Harbor | 37.49883 | -122.48753 | 2 | PRESENT | 0 | ABSENT |
| 2026-03-16 | Goleta Pier | 34.41287 | -119.82814 | 15 | COMMON | 0 | ABSENT |
| 2026-03-12 | Port San Luis, Diablo Cove | 35.14469 | -120.8166 | 20 | COMMON | 0 | ABSENT |
| 2026-03-10 | Wilson Creek | 41.6016 | -124.10232 | 0 | ABSENT | 0 | ABSENT |
| 2026-03-10 | Palos Verdes, OFFSHORE | 33.72522 | -118.35175 | 12 | COMMON | 0 | ABSENT |
| 2026-03-10 | Mendocino, Noyo Harbor | 39.42448 | -123.8008 | 0 | ABSENT | 0 | ABSENT |
| 2026-03-25 | Santa Cruz Wharf | 36.95739 | -122.01764 | 15 | COMMON | 0.5 | RARE |
| 2026-03-31 | Humboldt Bay, Indian Is. Ch. | 40.81371 | -124.15952 | 2 | PRESENT | 0 | ABSENT |
| 2026-03-12 | Pillar Point Harbor | 37.49883 | -122.48753 | 0.5 | RARE | 0 | ABSENT |
| 2026-03-05 | Newport Bay, Back Bay | 33.62172 | -117.89309 | 0 | ABSENT | 0 | ABSENT |
| 2026-03-20 | Bolsa Chica | 33.68344 | -118.03494 | 0 | ABSENT | 0 | ABSENT |
| 2026-03-20 | Pacifica Pier | 37.63351 | -122.49811 | 5 | PRESENT | 0 | ABSENT |
| 2026-03-18 | Oceanside Harbor | 33.19435 | -117.38415 | 0.5 | RARE | 0 | ABSENT |
| 2026-03-18 | Port San Luis, Diablo Cove | 35.14469 | -120.8166 | 10 | COMMON | 0 | ABSENT |
| 2026-03-23 | Humboldt Bay, Indian Is. Ch. | 40.81371 | -124.15952 | 0 | ABSENT | 0 | ABSENT |
| 2026-03-18 | San Clemente Pier | 33.4217 | -117.6218 | 0.5 | RARE | 0 | ABSENT |
| 2026-03-17 | Santa Monica Bay | 33.94475 | -118.58078 | 0 | ABSENT | 0 | ABSENT |
| 2026-03-23 | Tomales Bay, Lease #M430-15 | 38.2176 | -122.9437 | 1 | PRESENT | 0 | ABSENT |
| 2026-03-23 | La Jolla, Scripps Pier | 32.86716 | -117.25759 | 0 | ABSENT | 0.5 | RARE |
| 2026-03-16 | La Jolla, Scripps Pier | 32.86716 | -117.25759 | 1 | PRESENT | 0.5 | RARE |
| 2026-03-31 | Ventura, Offshore Station 3 | 34.23557 | -119.3922 | 0.5 | RARE | 0 | ABSENT |
| 2026-03-25 | Imperial Beach Pier | 32.57962 | -117.13742 | 4 | PRESENT | 0 | ABSENT |
| 2026-03-24 | Shell Beach, Sea Ranch | 38.72636 | -123.48052 | 0 | ABSENT | 0 | ABSENT |
| 2026-03-25 | San Diego Bay, U.S. Navy Pier | 32.7 | -117.236 | 0 | ABSENT | 0 | ABSENT |
| 2026-03-24 | Hunter Rock, north | 41.95971 | -124.2079 | 0.5 | RARE | 0 | ABSENT |
| 2026-03-11 | San Diego Bay, U.S. Navy Pier | 32.7 | -117.236 | 0 | ABSENT | 0 | ABSENT |
| 2026-03-21 | Cayucos Pier | 35.44647 | -120.90775 | 15 | COMMON | 0.5 | RARE |
| 2026-03-24 | Santa Monica Pier | 34.0072 | -118.4985 | 0 | ABSENT | 0 | ABSENT |
| 2026-03-20 | Santa Barbara Ch., Naples Pt | 34.4204 | -119.953 | 0 | ABSENT | 0 | ABSENT |
| 2026-03-30 | Point Arena Pier | 38.9147 | -123.71124 | 8 | PRESENT | 0.5 | RARE |
| 2026-03-27 | Bolsa Chica | 33.68344 | -118.03494 | 0 | ABSENT | 0 | ABSENT |
| 2026-03-24 | Wilson Creek | 41.6016 | -124.10232 | 4 | PRESENT | 0.5 | RARE |
| 2026-03-27 | Pacifica Pier | 37.63351 | -122.49811 | 4 | PRESENT | 0 | ABSENT |
| 2026-03-26 | Cayucos Pier | 35.44647 | -120.90775 | 15 | COMMON | 0 | ABSENT |
| 2026-03-31 | Wilson Creek | 41.6016 | -124.10232 | 10 | COMMON | 0 | ABSENT |
| 2026-03-30 | La Jolla, Scripps Pier | 32.86716 | -117.25759 | 2 | PRESENT | 0 | ABSENT |
| 2026-03-31 | Pacific Beach Pier | 32.79599 | -117.25834 | 0 | ABSENT | 0 | ABSENT |
| 2026-03-17 | Mendocino, Noyo Harbor | 39.42448 | -123.8008 | 0 | ABSENT | 0 | ABSENT |
| 2026-03-18 | San Diego Bay, U.S. Navy Pier | 32.7 | -117.236 | 0 | ABSENT | 0 | ABSENT |
| 2026-03-27 | Ventura Pier | 34.27208 | -119.29275 | 0 | ABSENT | 0 | ABSENT |
| 2026-03-24 | Kashia Coastal Reserve | 38.61616 | -123.37475 | 0.5 | RARE | 0 | ABSENT |
| 2026-03-26 | Newport Bay, Back Bay | 33.62172 | -117.89309 | 0 | ABSENT | 0 | ABSENT |
| 2026-03-18 | Newport Bay, Back Bay | 33.62172 | -117.89309 | 0 | ABSENT | 0 | ABSENT |
| 2026-04-04 | Pillar Point Harbor | 37.49883 | -122.48753 | 0 | ABSENT | 0.5 | RARE |
| 2026-04-06 | Humboldt Bay, Bird Island | 40.844 | -124.1137 | 7 | PRESENT | 0 | ABSENT |
| 2026-04-06 | Morro Bay, Boat Launch | 35.35703 | -120.85021 | 4 | PRESENT | 0.5 | RARE |
| 2026-04-01 | Monterey, Stillwater Cove | 36.56581 | -121.94293 | 2 | PRESENT | 0 | ABSENT |
| 2026-04-01 | San Diego Bay, U.S. Navy Pier | 32.7 | -117.236 | 0 | ABSENT | 0 | ABSENT |
| 2026-04-06 | Bodega Harbor, USCG Dock | 38.31277 | -123.0513 | 5 | PRESENT | 0.5 | RARE |
| 2026-04-01 | Imperial Beach Pier | 32.57962 | -117.13742 | 0.5 | RARE | 0 | ABSENT |
| 2026-04-13 | Morro Bay, Boat Launch | 35.35703 | -120.85021 | 0 | ABSENT | 0 | ABSENT |
| 2026-04-13 | Humboldt Bay, Bird Island | 40.844 | -124.1137 | 1 | PRESENT | 0 | ABSENT |
| 2026-04-01 | Palos Verdes, OFFSHORE | 33.72522 | -118.35175 | 0.5 | RARE | 0 | ABSENT |
| 2026-04-08 | Pillar Point Harbor | 37.49883 | -122.48753 | 0 | ABSENT | 0.5 | RARE |
| 2026-04-06 | Tomales Bay, Lease #M430-15 | 38.2176 | -122.9437 | 0.5 | RARE | 0.5 | RARE |
| 2026-04-06 | La Jolla, Scripps Pier | 32.86716 | -117.25759 | 2 | PRESENT | 0 | ABSENT |
| 2026-04-04 | Cayucos Pier | 35.44647 | -120.90775 | 0.5 | RARE | 0 | ABSENT |
| 2026-04-01 | Goleta Pier | 34.41287 | -119.82814 | 0 | ABSENT | 0 | ABSENT |
| 2026-04-03 | Bolsa Chica | 33.68344 | -118.03494 | 0 | ABSENT | 0.5 | RARE |
| 2026-04-06 | San Clemente Pier | 33.4217 | -117.6218 | 0 | ABSENT | 0 | ABSENT |
| 2026-04-20 | Richmond, Marina Bay Harbor | 37.91386 | -122.35416 | 0 | ABSENT | 0.5 | RARE |
| 2026-04-07 | Mendocino, Noyo Harbor | 39.42448 | -123.8008 | 0.5 | RARE | 0.5 | RARE |
| 2026-04-17 | Santa Cruz Wharf | 36.95739 | -122.01764 | 0 | ABSENT | 0.5 | RARE |
| 2026-04-14 | Point Richmond, Ferry Point | 37.90901 | -122.39105 | 0 | ABSENT | 0.5 | RARE |
| 2026-04-13 | Tomales Bay, Lease #M430-15 | 38.2176 | -122.9437 | 0 | ABSENT | 0.5 | RARE |
| 2026-04-01 | Santa Cruz Wharf | 36.95739 | -122.01764 | 0.5 | RARE | 0.5 | RARE |
| 2026-04-08 | San Diego Bay, U.S. Navy Pier | 32.7 | -117.236 | 0 | ABSENT | 0 | ABSENT |
| 2026-04-11 | Venice Pier | 33.9809 | -118.4748 | 0.5 | RARE | 0 | ABSENT |
| 2026-04-09 | Port San Luis, Diablo Cove | 35.14469 | -120.8166 | 0 | ABSENT | 0 | ABSENT |
| 2026-04-15 | San Diego Bay, U.S. Navy Pier | 32.7 | -117.236 | 0 | ABSENT | 0 | ABSENT |
| 2026-04-13 | Point Arena Pier | 38.9147 | -123.71124 | 0 | ABSENT | 0 | ABSENT |
| 2026-04-27 | Tomales Bay, Lease #M430-15 | 38.2176 | -122.9437 | 1 | PRESENT | 0.5 | RARE |
| 2026-04-27 | Humboldt Bay, Bird Island | 40.844 | -124.1137 | 0 | ABSENT | 0 | ABSENT |
| 2026-04-27 | Drakes Bay, Chimney Rock LBS | 37.99481 | -122.97327 | 0 | ABSENT | 0 | ABSENT |
| 2026-04-15 | Santa Cruz Wharf | 36.95739 | -122.01764 | 0 | ABSENT | 0 | ABSENT |
| 2026-04-15 | Goleta Pier | 34.41287 | -119.82814 | 7 | PRESENT | 0 | ABSENT |
| 2026-04-06 | Wilson Creek | 41.6016 | -124.10232 | 4 | PRESENT | 0 | ABSENT |
| 2026-04-20 | Morro Bay, Boat Launch | 35.35703 | -120.85021 | 0 | ABSENT | 0 | ABSENT |
| 2026-04-21 | Humboldt Bay, Bird Island | 40.844 | -124.1137 | 0 | ABSENT | 0 | ABSENT |
| 2026-04-20 | Tomales Bay, Lease #M430-15 | 38.2176 | -122.9437 | 0 | ABSENT | 0.5 | RARE |
| 2026-04-09 | Pillar Point Harbor | 37.49883 | -122.48753 | 0 | ABSENT | 0 | ABSENT |
| 2026-04-09 | Bean Hollow State Beach | 37.2243 | -122.4095 | 0 | ABSENT | 0 | ABSENT |
| 2026-04-22 | Palos Verdes, OFFSHORE | 33.72522 | -118.35175 | 15 | COMMON | 0 | ABSENT |
| 2026-04-24 | Newport Bay, Back Bay | 33.62172 | -117.89309 | 0 | ABSENT | 0 | ABSENT |
| 2026-04-22 | Kashia Coastal Reserve | 38.61616 | -123.37475 | 0 | ABSENT | 0 | ABSENT |
| 2026-04-23 | Hunter Rock, north | 41.95971 | -124.2079 | 0.5 | RARE | 0 | ABSENT |
| 2026-04-20 | La Jolla, Scripps Pier | 32.86716 | -117.25759 | 2 | PRESENT | 0 | ABSENT |
| 2026-04-23 | San Diego Bay, U.S. Navy Pier | 32.7 | -117.236 | 0 | ABSENT | 0 | ABSENT |
| 2026-04-22 | Wilson Creek | 41.6016 | -124.10232 | 0.5 | RARE | 0 | ABSENT |
| 2026-04-20 | Port San Luis, Diablo Cove | 35.14469 | -120.8166 | 3 | PRESENT | 0 | ABSENT |
| 2026-04-23 | Monterey Bay, Commercial Wharf | 36.60572 | -121.88941 | 0.5 | RARE | 0 | ABSENT |
| 2026-04-24 | Bolsa Chica | 33.68344 | -118.03494 | 5 | PRESENT | 0 | ABSENT |
| 2026-04-26 | Cayucos Pier | 35.44647 | -120.90775 | 1 | PRESENT | 0 | ABSENT |
| 2026-04-26 | Pacifica Pier | 37.63351 | -122.49811 | 1 | PRESENT | 0 | ABSENT |
| 2026-04-30 | Santa Monica Pier | 34.0072 | -118.4985 | 5 | PRESENT | 0 | ABSENT |
| 2026-04-27 | Manhattan Beach Pier | 33.8856 | -118.4137 | 15 | COMMON | 0 | ABSENT |
| 2026-04-27 | La Jolla, Scripps Pier | 32.86716 | -117.25759 | 4 | PRESENT | 0.5 | RARE |
| 2026-04-25 | Pillar Point Harbor | 37.49883 | -122.48753 | 2 | PRESENT | 0 | ABSENT |
| 2026-04-22 | Pillar Point Harbor | 37.49883 | -122.48753 | 0 | ABSENT | 5 | PRESENT |
| 2026-04-10 | Newport Bay, Back Bay | 33.62172 | -117.89309 | 0 | ABSENT | 0 | ABSENT |
| 2026-04-08 | Bolsa Chica | 33.68344 | -118.03494 | 0 | ABSENT | 0 | ABSENT |
| 2026-04-13 | Mendocino, Noyo Harbor | 39.42448 | -123.8008 | 0 | ABSENT | 0 | ABSENT |
| 2026-04-22 | Imperial Beach Pier | 32.57962 | -117.13742 | 0 | ABSENT | 0 | ABSENT |
| 2026-04-16 | San Simeon Pier | 35.64078 | -121.18803 | 0 | ABSENT | 0 | ABSENT |
| 2026-04-17 | Santa Barbara, Mohawk Reef | 34.3944 | -119.73 | 5 | PRESENT | 0 | ABSENT |
| 2026-04-17 | Newport Bay, Back Bay | 33.62172 | -117.89309 | 0 | ABSENT | 0 | ABSENT |
| 2026-04-29 | Santa Cruz, Capitola Pier | 36.96903 | -121.95314 | 6 | PRESENT | 1 | PRESENT |
| 2026-04-21 | Mendocino, Noyo Harbor | 39.42448 | -123.8008 | 0 | ABSENT | 0 | ABSENT |
| 2026-04-17 | Bolsa Chica | 33.68344 | -118.03494 | 0 | ABSENT | 0.5 | RARE |
| 2026-04-18 | Cayucos Pier | 35.44647 | -120.90775 | 0 | ABSENT | 0 | ABSENT |
| 2026-04-22 | Pacific Beach Pier | 32.79599 | -117.25834 | 0 | ABSENT | 0 | ABSENT |
| 2026-04-13 | La Jolla, Scripps Pier | 32.86716 | -117.25759 | 2 | PRESENT | 0 | ABSENT |
| 2026-04-22 | San Clemente Pier | 33.4217 | -117.6218 | 0 | ABSENT | 0 | ABSENT |
| 2026-04-22 | Santa Cruz Wharf | 36.95739 | -122.01764 | 7 | PRESENT | 0.5 | RARE |
| 2026-04-27 | Morro Bay, Boat Launch | 35.35703 | -120.85021 | 5 | PRESENT | 0 | ABSENT |
| 2026-04-29 | Santa Monica Pier | 34.0072 | -118.4985 | 55 | ABUNDANT | 0 | ABSENT |
| 2026-04-29 | San Simeon Pier | 35.64078 | -121.18803 | 0 | ABSENT | 0.5 | RARE |
| 2026-04-17 | Santa Barbara Ch., Naples Pt | 34.4204 | -119.953 | 15 | COMMON | 1 | PRESENT |
| 2026-04-29 | Goleta Pier | 34.41287 | -119.82814 | 9 | PRESENT | 0.5 | RARE |
| 2026-04-26 | Ventura Pier | 34.27208 | -119.29275 | 65 | ABUNDANT | 0 | ABSENT |
| 2026-04-30 | San Diego Bay, U.S. Navy Pier | 32.7 | -117.236 | 0 | ABSENT | 0 | ABSENT |
Domoic acid (DA) is a potent neurotoxin produced by some diatom species of the genus Pseudo-nitzschia. Species exposed to DA can result in seizures, epilepsy, cardiomyopathy, and death depending upon the ingested dose. DA toxicosis commonly occurs in California sea lions (Zalophus californianus), presumably due to a combination of foraging behavior and seasonal movements.
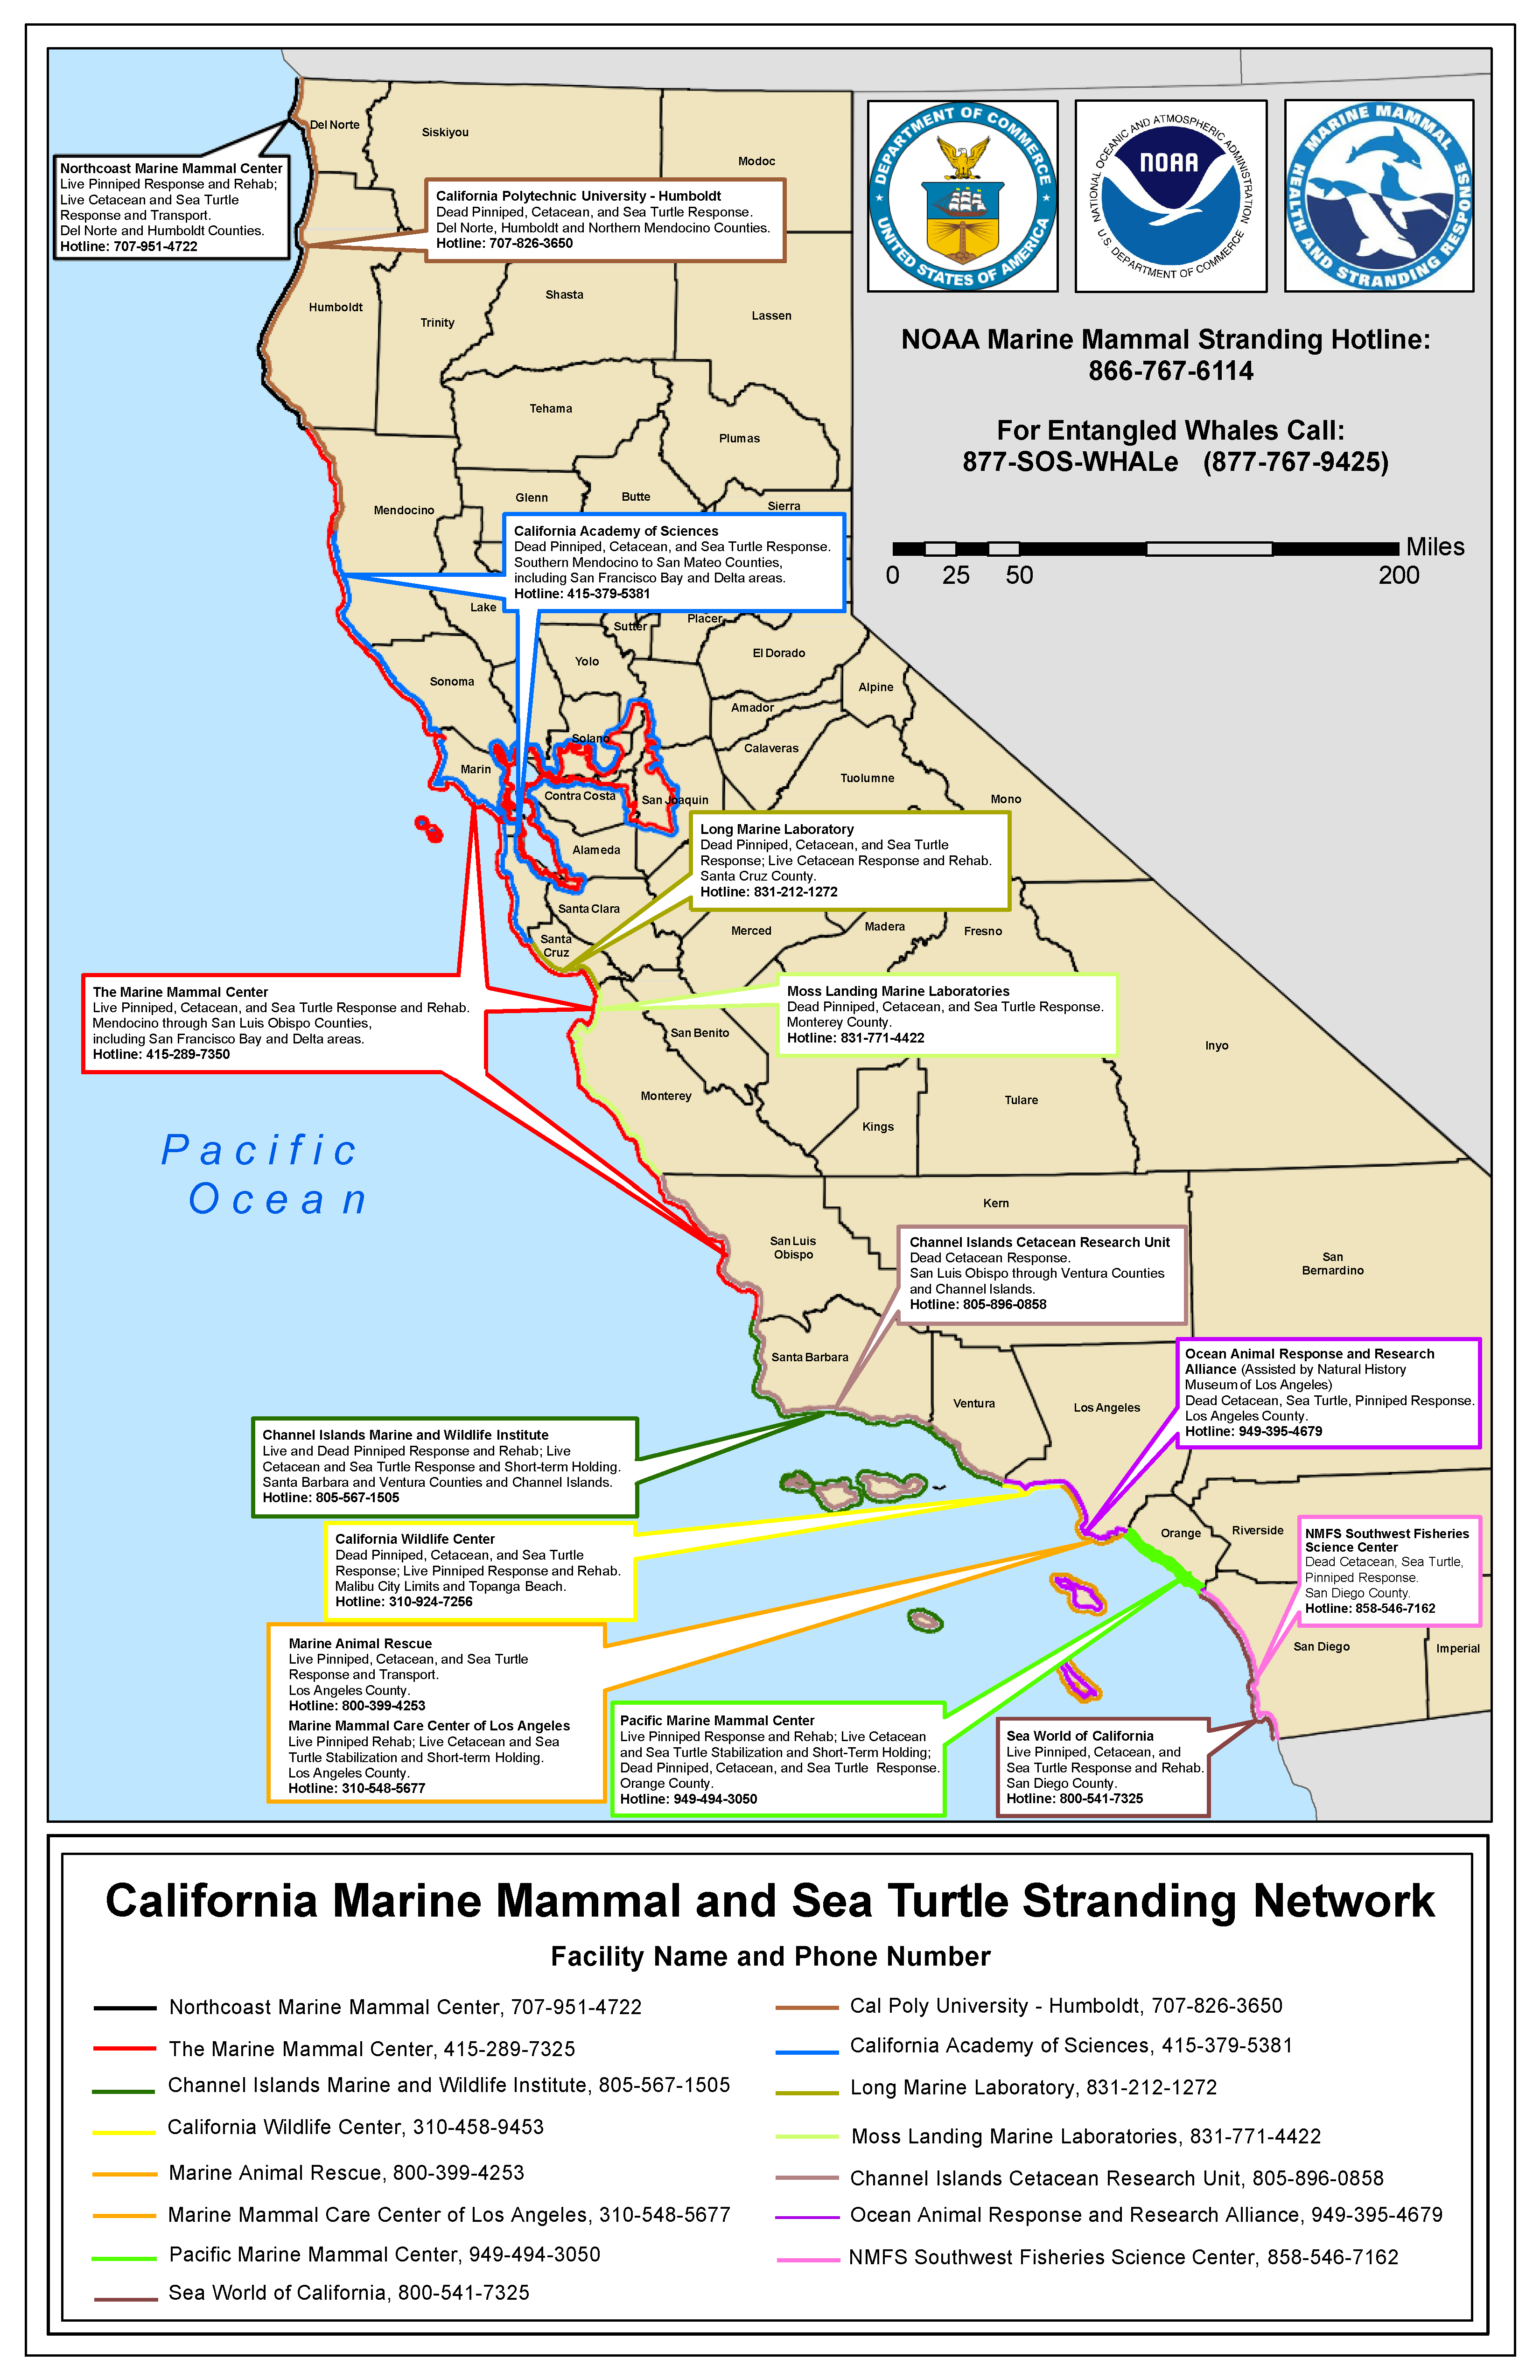
The Marine Mammal Center (TMMC), Channel Islands Marine Wildlife Institute (CIMWI), California Wildlife Center (CWC), Marine Mammal Care Center Los Angeles (MMCC-LA), Pacific Marine Mammal Center (PMMC), SeaWorld, and Southwest Fisheries Science Center (SWFSC) act like an emergency room by working to rescue and rehabilitate sick and injured marine mammals, seabirds, and sea turtles.
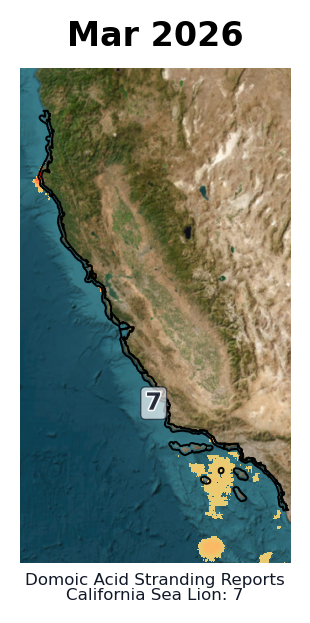
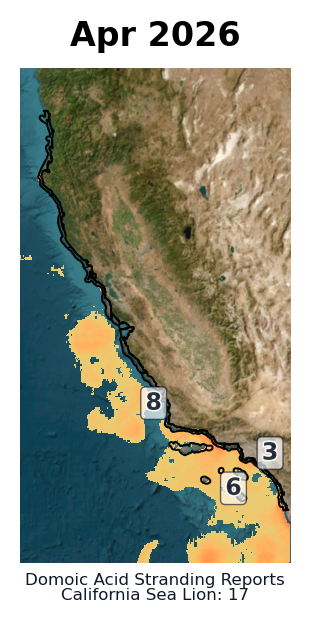
The maps above depict approximate county-level locations of domoic acid-related strandings of California sea lions, based on the reporting center. An overlay of C-HARM model output shows areas where the monthly average predicted probability of particulate domoic acid (pDA) exceeding the alert-level threshold of 500 ng/L was greater than 70%.
California's Marine Mammal Stranding Network Map
California HAB Bulletin
All data and reports have been synthesized by SCCOOS for the California Harmful Algal Bloom Monthly Bulletin.
Data Access & Resources:
C-HARM, NOAA CoastWatch ERDDAP
Toxic Phytoplankton Observations, CDPH
Imaging FlowCytoBot Dashboard
CalHABMAP Datasets, SCCOOS ERDDAP