The current observing effort will help to relate past wave and water level conditions to reported flooding events at Imperial Beach.
The relative contributions of tides, waves, and sea level will be documented for coastal flooding events at various sites around the city.
Select year, then date to see data and documentation for that flooding event or click a point below to see a brief summary of that event.
High tide vs. runup for each day of observed historical flooding at 5 sites in Imperial Beach.
We seek to describe the ocean conditions that have led to past flooding events at Imperial Beach.
Historic flood analysis will help to determine flood thresholds at different locations throughout the city.
Time series of estimated total water level and the relative contributions of tides, wave runup, and sea level provide a summary of the conditions contributing to reported flooding events.
The wave runup formulation is described here. Peak period is used instead of average period in the waves calculation.
Here we include sea level variations that are omitted from the CDIP Flooding Index.
Levels are referenced to MLLW (Mean Lower Low Water).
Tide and sea level observations are taken from the NOAA tide station in La Jolla, CA.
Total water level before, during, and after a day of observed flooding. Total water level is broken down into tide,
water level, and waves and is referenced to MLLW (Mean Lower Low Water).
Tide observations are taken from the NOAA tide station in La Jolla, CA and waves are estimated from the CDIP regional wave model.
1 / 7
The end of Palm Avenue, March 2nd. Flooding worsened here during the morning high tide of March 2nd. by Serge Dedina
2 / 7
With high surf and high tides on the evening of March 1st, water came over the beach and into Seacoast Drive. Here is the end of Descanso Street the morning of March 2nd. by Serge Dedina
3 / 7
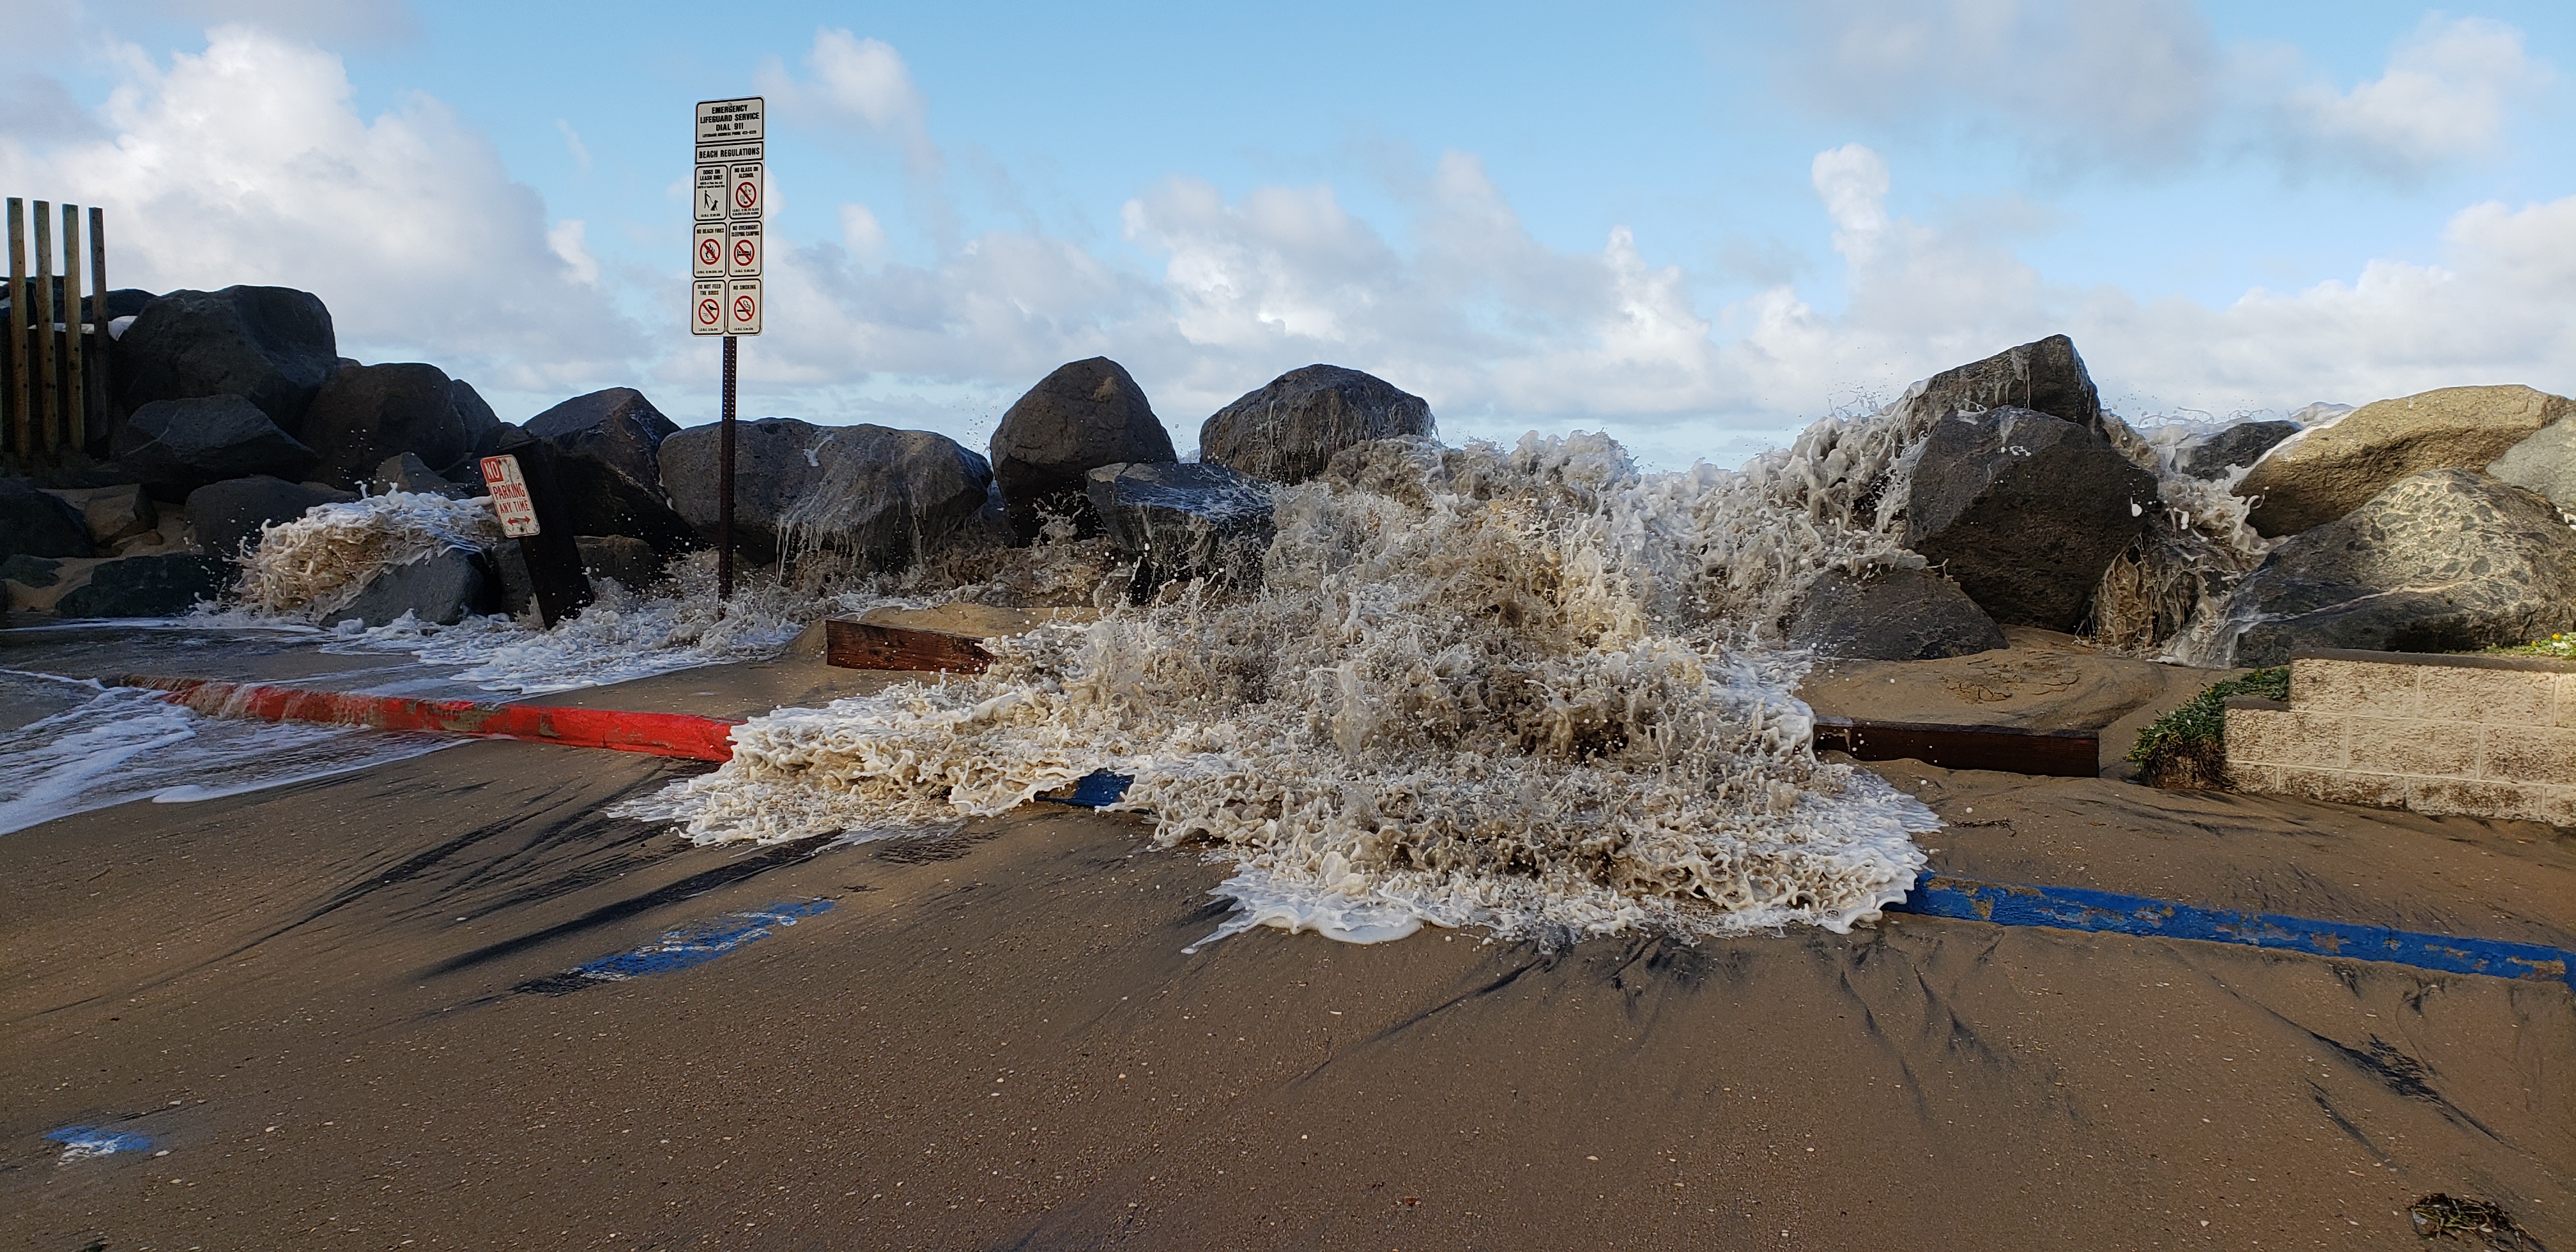
The surf tripled in size on Saturday March 1st and by the end of the day was breaking out past the Imperial Beach Pier. by Serge Dedina
4 / 7
Ocean Lane just north of Palm Avenue, March 2nd. by Serge Dedina
5 / 7
Just north of Palm Avenue, March 2nd. by Serge Dedina
6 / 7
The end of Seacoast Drive, March 2nd. by Serge Dedina
7 / 7
The end of Encanto Street on March 2nd. by Serge Dedina
We seek to describe the ocean conditions that have led to past flooding events at Imperial Beach.
Historic flood analysis will help to determine flood thresholds at different locations throughout the city.
Time series of estimated total water level and the relative contributions of tides, wave runup, and sea level provide a summary of the conditions contributing to reported flooding events.
The wave runup formulation is described here. Peak period is used instead of average period in the waves calculation.
Here we include sea level variations that are omitted from the CDIP Flooding Index.
Levels are referenced to MLLW (Mean Lower Low Water).
Tide and sea level observations are taken from the NOAA tide station in La Jolla, CA.
1 / 16
Descanso Ave. and Seacoast Dr. (photo by the City of IB)
2 / 16
Descanso Ave. and Seacoast Dr. inundated with water
3 / 16
Descanso Ave. and Seacoast Dr. inundated with water
We seek to describe the ocean conditions that have led to past flooding events at Imperial Beach.
Historic flood analysis will help to determine flood thresholds at different locations throughout the city.
Time series of estimated total water level and the relative contributions of tides, wave runup, and sea level provide a summary of the conditions contributing to reported flooding events.
The wave runup formulation is described here. Peak period is used instead of average period in the waves calculation.
Here we include sea level variations that are omitted from the CDIP Flooding Index.
Levels are referenced to MLLW (Mean Lower Low Water).
Tide and sea level observations are taken from the NOAA tide station in La Jolla, CA.
1 / 2
Cortez Ave. and Seacoast Dr. (photo by the City of IB)
2 / 2
Date Ave. and Seacoast Dr. (photo by the City of IB)
We seek to describe the ocean conditions that have led to past flooding events at Imperial Beach.
Historic flood analysis will help to determine flood thresholds at different locations throughout the city.
Time series of estimated total water level and the relative contributions of tides, wave runup, and sea level provide a summary of the conditions contributing to reported flooding events.
The wave runup formulation is described here. Peak period is used instead of average period in the waves calculation.
Here we include sea level variations that are omitted from the CDIP Flooding Index.
Levels are referenced to MLLW (Mean Lower Low Water).
Tide and sea level observations are taken from the NOAA tide station in La Jolla, CA.
During the January 2018 king tide, a city employee uses a broom to push water towards the drain at the end of Imperial Beach’s Seacoast Drive.
Roberto "Bear" Guerra)
We seek to describe the ocean conditions that have led to past flooding events at Imperial Beach.
Historic flood analysis will help to determine flood thresholds at different locations throughout the city.
Time series of estimated total water level and the relative contributions of tides, wave runup, and sea level provide a summary of the conditions contributing to reported flooding events.
The wave runup formulation is described here. Peak period is used instead of average period in the waves calculation.
Here we include sea level variations that are omitted from the CDIP Flooding Index.
Levels are referenced to MLLW (Mean Lower Low Water).
Tide and sea level observations are taken from the NOAA tide station in La Jolla, CA.
1 / 18
Palm Plaza during a flooding event
2 / 18
Descanso Ave. and Seacoast Dr. during a flooding event
3 / 18
Cortez Ave. and Seacoast Dr. during a flooding event
4 / 18
End of Cortez Ave. during a flooding event
5 / 18
End of Cortez Ave. during a flooding event
6 / 18
End of Cortez Ave. during a flooding event
7 / 18
End of Descanso Ave. during a flooding event
8 / 18
End of Descanso Ave. during a flooding event
9 / 18
Encanto Ave. and Seacoast Dr. during a flooding event
We seek to describe the ocean conditions that have led to past flooding events at Imperial Beach.
Historic flood analysis will help to determine flood thresholds at different locations throughout the city.
Time series of estimated total water level and the relative contributions of tides, wave runup, and sea level provide a summary of the conditions contributing to reported flooding events.
The wave runup formulation is described here. Peak period is used instead of average period in the waves calculation.
Here we include sea level variations that are omitted from the CDIP Flooding Index.
Levels are referenced to MLLW (Mean Lower Low Water).
Tide and sea level observations are taken from the NOAA tide station in La Jolla, CA.
1 / 14
Cortez Ave. and Seacoast Dr. during a flooding event
2 / 14
Cortez Ave. and Seacoast Dr. during a flooding event
3 / 14
End of Cortez Ave. during a flooding event
4 / 14
Cortez Ave. and Seacoast Dr. during a flooding event
5 / 14
Cortez Ave. and Seacoast Dr. during a flooding event
6 / 14
Cortez Ave. and Seacoast Dr. during a flooding event
We seek to describe the ocean conditions that have led to past flooding events at Imperial Beach.
Historic flood analysis will help to determine flood thresholds at different locations throughout the city.
Time series of estimated total water level and the relative contributions of tides, wave runup, and sea level provide a summary of the conditions contributing to reported flooding events.
The wave runup formulation is described here. Peak period is used instead of average period in the waves calculation.
Here we include sea level variations that are omitted from the CDIP Flooding Index.
Levels are referenced to MLLW (Mean Lower Low Water).
Tide and sea level observations are taken from the NOAA tide station in La Jolla, CA.
1 / 19
Cortez Ave. and Seacoast Dr. during a flooding event
2 / 19
Residual sand from Palm Plaza during a flooding event
3 / 19
Residual sand from Palm Plaza during a flooding event
4 / 19
Water runs up the beach and into Palm Plaza during a flooding event
5 / 19
Descanso Ave. and Seacoast Dr. during a flooding event
6 / 19
Beach facing north towards the IB pier
7 / 19
The end of Cortez Ave. during a flooding event
8 / 19
Water floods a parking garage on Seacoast Dr.
9 / 19
The end of Cortez Ave. during a flooding event
10 / 19
Flooding at a house on Cortez Ave.
11 / 19
Cortez Ave. and Seacoast Dr. during a flooding event
12 / 19
The end of Descanso Ave. during a flooding event
13 / 19
Descanso Ave. and Seacoast Dr. during a flooding event
14 / 19
Descanso Ave. and Seacoast Dr. during a flooding event
15 / 19
Descanso Ave. and Seacoast Dr. during a flooding event
16 / 19
Water pooled in the street flows into the estuary
17 / 19
Water pooled in the street flows into the estuary
18 / 19
Water flows from the beach, through a staircase between houses
We seek to describe the ocean conditions that have led to past flooding events at Imperial Beach.
Historic flood analysis will help to determine flood thresholds at different locations throughout the city.
Time series of estimated total water level and the relative contributions of tides, wave runup, and sea level provide a summary of the conditions contributing to reported flooding events.
The wave runup formulation is described here. Peak period is used instead of average period in the waves calculation.
Here we include sea level variations that are omitted from the CDIP Flooding Index.
Levels are referenced to MLLW (Mean Lower Low Water).
Tide and sea level observations are taken from the NOAA tide station in La Jolla, CA.
1 / 3
The end of Cortez Ave. during a flooding event
2 / 3
Residual water pooled at the end of Seacoast Dr. after a flooding event
3 / 3
Sand and cobbles deposited in the estuary at the end of Seacoast Dr. after a flooding event
We seek to describe the ocean conditions that have led to past flooding events at Imperial Beach.
Historic flood analysis will help to determine flood thresholds at different locations throughout the city.
Time series of estimated total water level and the relative contributions of tides, wave runup, and sea level provide a summary of the conditions contributing to reported flooding events.
The wave runup formulation is described here. Peak period is used instead of average period in the waves calculation.
Here we include sea level variations that are omitted from the CDIP Flooding Index.
Levels are referenced to MLLW (Mean Lower Low Water).
Tide and sea level observations are taken from the NOAA tide station in La Jolla, CA.
1 / 19
Residual water pooled at the end of Seacoast Dr. after a flooding event
2 / 19
Water wraps around into Palm Plaza
3 / 19
Extent of water in front of Dunes Park
4 / 19
Residual water and sand at Cortez Ave.
5 / 19
Sand at the end of Descanso Ave. post flooding event
6 / 19
Water filters throught he rocks into Cortez Ave.
7 / 19
Beach looking north towards the IB pier
8 / 19
Beach looking south towards Tijuana
9 / 19
Water pooled at the end of Seacoast Dr.
10 / 19
Flooding at the end of Descanso Ave.
11 / 19
Berm at the end of Seacoast Dr.
12 / 19
Water pools at the end of Seacoast Dr.
13 / 19
Water pools at the end of Seacoast Dr.
14 / 19
Water from the the end of Seacoast Dr. flows into the estuary
15 / 19
Residual sand from water flow at the end of Seacoast Dr.
We seek to describe the ocean conditions that have led to past flooding events at Imperial Beach.
Historic flood analysis will help to determine flood thresholds at different locations throughout the city.
Time series of estimated total water level and the relative contributions of tides, wave runup, and sea level provide a summary of the conditions contributing to reported flooding events.
The wave runup formulation is described here. Peak period is used instead of average period in the waves calculation.
Here we include sea level variations that are omitted from the CDIP Flooding Index.
Levels are referenced to MLLW (Mean Lower Low Water).
Tide and sea level observations are taken from the NOAA tide station in La Jolla, CA.
1 / 11
Water rushes down Cortez Ave. during a flooding event
2 / 11
Waves at the end of Cortez Ave.
3 / 11
Water trickles down Descanso Ave. during a flooding event
4 / 11
Building a small berm at the end of Descanso Ave.
5 / 11
Water pools at the intersection of Descanso Ave. and Seacoast Dr.
6 / 11
Water rushes from the beach towards the road at Descanso Ave.
7 / 11
The end of Encanto Ave. during a flooding event
8 / 11
Fishing as the water comes up at the end of Encanto Ave.
9 / 11
Water pools at the end of Seacoast Dr. during a flooding event
10 / 11
The end of Seacoast Dr. during a flooding event
11 / 11
Water begins to wrap around the wall at Palm Plaza
We seek to describe the ocean conditions that have led to past flooding events at Imperial Beach.
Historic flood analysis will help to determine flood thresholds at different locations throughout the city.
Time series of estimated total water level and the relative contributions of tides, wave runup, and sea level provide a summary of the conditions contributing to reported flooding events.
The wave runup formulation is described here. Peak period is used instead of average period in the waves calculation.
Here we include sea level variations that are omitted from the CDIP Flooding Index.
Levels are referenced to MLLW (Mean Lower Low Water).
Tide and sea level observations are taken from the NOAA tide station in La Jolla, CA.
1 / 14
Water rushes through rocks to Cortez Ave. during a flooding event
2 / 14
Water rushes down Cortez Ave. during a flooding event
3 / 14
Water rushes through rocks to Descanso Ave. during a flooding event
4 / 14
Water rushes through rocks to Descanso Ave. during a flooding event
5 / 14
Residual sand and water on Descanso Ave.
6 / 14
Residual sand and water on Encanto Ave.
7 / 14
Waves at the end of Encanto Ave.
8 / 14
Residual sand and cobbles at the end of Seacoast Dr.
9 / 14
Foamy water pools at the end of Seacoast Dr. during a flooding event
10 / 14
Waves at the end of Seacoast Dr. during a flooding event
11 / 14
Water pools at Palm Plaza during a flooding event
12 / 14
Water pools at Palm Plaza during a flooding event
13 / 14
Seaweed remnants in Palm Plaza after a flooding event
14 / 14
Water flows down Cortez Ave. during a flooding event
We seek to describe the ocean conditions that have led to past flooding events at Imperial Beach.
Historic flood analysis will help to determine flood thresholds at different locations throughout the city.
Time series of estimated total water level and the relative contributions of tides, wave runup, and sea level provide a summary of the conditions contributing to reported flooding events.
The wave runup formulation is described here. Peak period is used instead of average period in the waves calculation.
Here we include sea level variations that are omitted from the CDIP Flooding Index.
Levels are referenced to MLLW (Mean Lower Low Water).
Tide and sea level observations are taken from the NOAA tide station in La Jolla, CA.
1 / 5
Flooding at the intersection of Cortez Ave. and Seacoast Dr.
2 / 5
Flooding at the intersection of Cortez Ave. and Seacoast Dr.
3 / 5
Trash can deposited in the middle of the road at Encanto Ave.
We seek to describe the ocean conditions that have led to past flooding events at Imperial Beach.
Historic flood analysis will help to determine flood thresholds at different locations throughout the city.
Time series of estimated total water level and the relative contributions of tides, wave runup, and sea level provide a summary of the conditions contributing to reported flooding events.
The wave runup formulation is described here. Peak period is used instead of average period in the waves calculation.
Here we include sea level variations that are omitted from the CDIP Flooding Index.
Levels are referenced to MLLW (Mean Lower Low Water).
Tide and sea level observations are taken from the NOAA tide station in La Jolla, CA.
1 / 15
Water crashes over the rip rap at the end of Cortez Ave.
2 / 15
Water crashes over the rip rap at the end of Cortez Ave.
3 / 15
Water crashes over the rip rap at the end of Cortez Ave.
4 / 15
Water crashes over the rip rap at the end of Cortez Ave.
5 / 15
Water flows through the rocks at the end of Descanso Ave.
6 / 15
Water flows through the rocks at the end of Descanso Ave.
7 / 15
Water flows down Descanso Ave.
8 / 15
Water flows towards Encanto Ave.
9 / 15
Water flows towards Encanto Ave.
10 / 15
Flooding at the end of Seacoast Dr.
11 / 15
Water flows towards Seacoast Dr.
12 / 15
Water flows towards Seacoast Dr.
13 / 15
Water flows from the ocean, through a walkway, to the estuary
We seek to describe the ocean conditions that have led to past flooding events at Imperial Beach.
Historic flood analysis will help to determine flood thresholds at different locations throughout the city.
Time series of estimated total water level and the relative contributions of tides, wave runup, and sea level provide a summary of the conditions contributing to reported flooding events.
The wave runup formulation is described here. Peak period is used instead of average period in the waves calculation.
Here we include sea level variations that are omitted from the CDIP Flooding Index.
Levels are referenced to MLLW (Mean Lower Low Water).
Tide and sea level observations are taken from the NOAA tide station in La Jolla, CA.
1 / 11
Water crashes over the rip rap at the end of Cortez Ave.
2 / 11
Water flows down Cortez Ave.
3 / 11
Flooding at the intersection of Cortez Ave. and Seacoast Dr.
4 / 11
Water flows towards Descanso Ave.
5 / 11
Water trickles down Descanso Ave.
6 / 11
Water flows through the rocks at the end of Encanto Ave.
We seek to describe the ocean conditions that have led to past flooding events at Imperial Beach.
Historic flood analysis will help to determine flood thresholds at different locations throughout the city.
Time series of estimated total water level and the relative contributions of tides, wave runup, and sea level provide a summary of the conditions contributing to reported flooding events.
The wave runup formulation is described here. Peak period is used instead of average period in the waves calculation.
Here we include sea level variations that are omitted from the CDIP Flooding Index.
Levels are referenced to MLLW (Mean Lower Low Water).
Tide and sea level observations are taken from the NOAA tide station in La Jolla, CA.